Double-Top on Pound-New Zealand Dollar Chart Augurs for Further Weakness

Image © DragonImages, Adobe Stock
- GBP/NZD exchange rate now at 1.9271
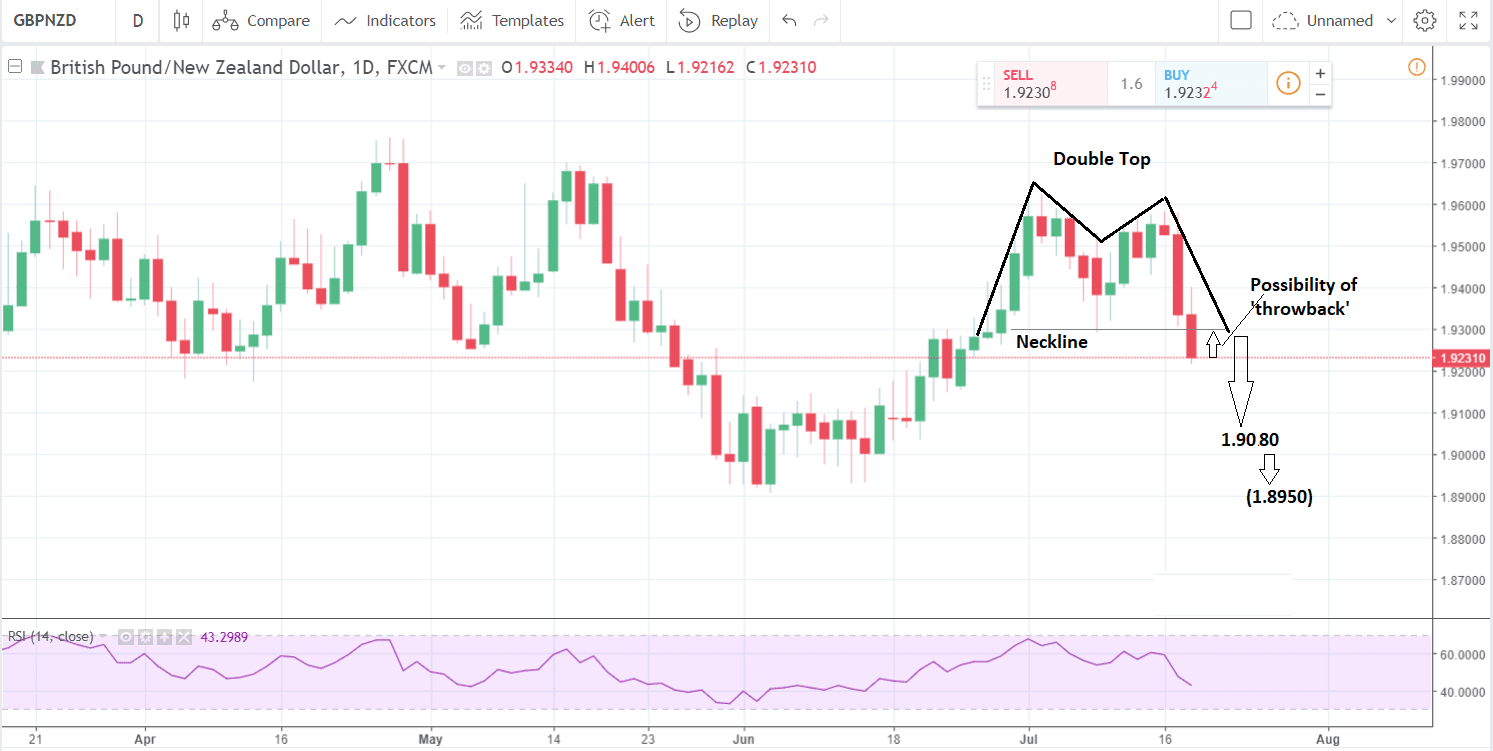
- Pair has formed a double top and broken lower indicating more downside
- We would caution traders not to get too bearish too quickly for two reasons
The Pound-to-New Zealand Dollar exchange rate is one of the worst performing GBP crosses thus far in the week with the exchange rate now at 1.9271; however it had been down to 1.9190 in the mid-week session.
Our studies suggest the bout of weakness has further to run thanks to the formation of a bearish technical chart pattern, which has just triggered to the downside and suggests even further weakness in the short-term.
This pattern a double top, looks like the letter 'M', and is a bearish reversal pattern, which often punctuates the end of uptrends, signalling a reversal down.
A necessary condition for further downside is for the bottom of the pattern, also known as the 'neckline', to be broken.
In the case of GBP/NZD this has already happened and suggests the pair may drill even lower in future sessions, to a conservative downside target at 1.9080, and a more liberal target of 1.8950.
We would, however, caution traders not to get too bearish too quickly for two reasons:
Firstly the pair may recover temporarily in and rise back up to the level of the neckline briefly in what is known as a 'throwback' before it resumes its downtrend and continues lower.
We also caution them not to expect bearishness over the medium-term, because the pair is currently trading within a protracted sideways range and when it reaches the floor at around 1.89-90 it will probably stall and possible even reverse higher again.
The sideways trend looks very much like a triangle pattern.
Triangles are usually composed of a minimum of five waves and this one has already formed four waves and is currently falling in the fifth lower (wave-e).
Once 'e' is complete the chances of a breakout increase, and are marginally biased to a breakout higher, given the bullish tenor to the rally prior the formation of the triangle and therefore the longer-term uptrend.
If there is a breakout higher, we would want to see a break above the wave-b highs at 1.9760 for confirmation first.
If so it would probably lead to a rally to a target at 2.0430, calculated from the height of the triangle at its widest point multiplied by the golden ratio of 0.618; which is the usual method used by technicians to establish minimum targets from pattern breakouts.
From the perspective of the double top, the pattern has formed at the top of wave-d and has signalled the beginning of the final wave 'e' lower, which now appears to be unfolding, so it falls in line with our current analysis of the pair.
The New Zealand Dollar has risen this week as a result of higher inflation expectations which have increased the probability that the central bank of New Zealand will respond by putting up interest rates. Higher interest rates are bullish for a currency as they increase inflows of foreign capital, drawn by the promise of higher returns.
In the UK the opposite has happened as lower-than-expected inflation data reduced the probabilities of the Bank of England (BOE) raising rates in August. Brexit uncertainty has further weakened the Pound.
Advertisement
Get up to 5% more foreign exchange by using a specialist provider to get closer to the real market rate and avoid the gaping spreads charged by your bank when providing currency. Learn more here


