Euro-Dollar Rate Flirts With Upside breakout Before Retreating, Bearish Forecast Stands

Image © kasto, Adobe Stock
- EUR/USD almost broke out higher on Tuesday but closed back down in range
- Bearish EUR/USD forecasts still dominate the technical community
- Positive assessment from the Fed could give green light to Dollar buying
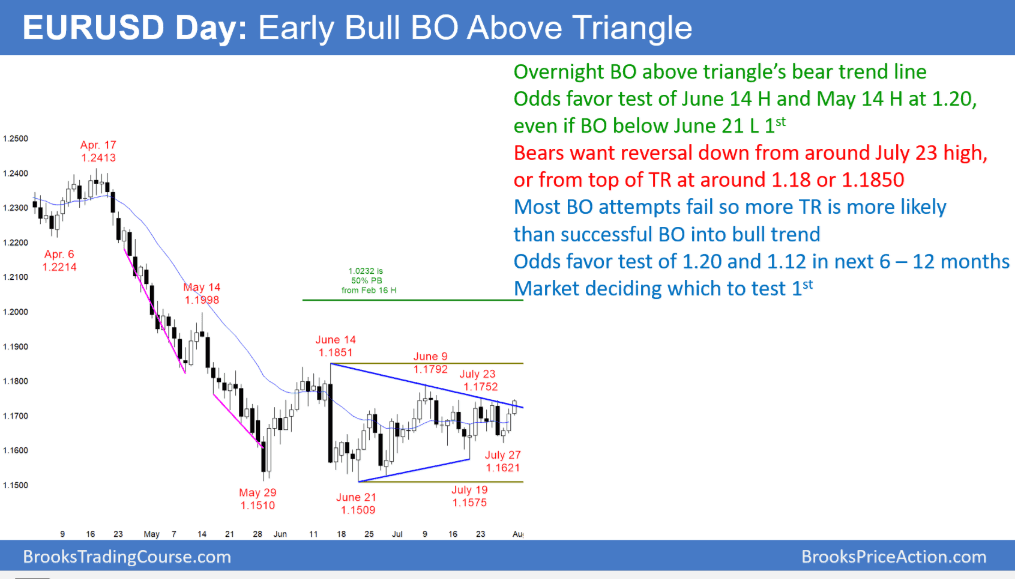
The Euro-to-Dollar exchange rate momentarily looked poised to break out of its range on Tuesday after rising up to an intraday high of 1.1746, which was above the upper border line of the recent range, however, it eventually pivoted and closed back down inside the range at 1.1690 after increasing trade woes bolstered the Dollar.
The momentary breakout was noted by analyst Al Brooks at who said, "The EUR/USD daily Forex chart is breaking above the bear trend line at the top of the 2 month triangle. Most breakout attempts fail, and there is other resistance above at the July 9 and June 14 highs."
Brook's insight that most breakouts 'fail' happened to be prescient as the pair ended up retracting back inside the triangle.
"My 80% rule says that 80% of trading range breakout attempts fail. All trading ranges eventually break into trends. However, most attempts fail. Consequently, while the past 3 days are good for the bulls, the rally is still more likely just a bull leg in the trading range than the start of a bull trend," says the analyst.
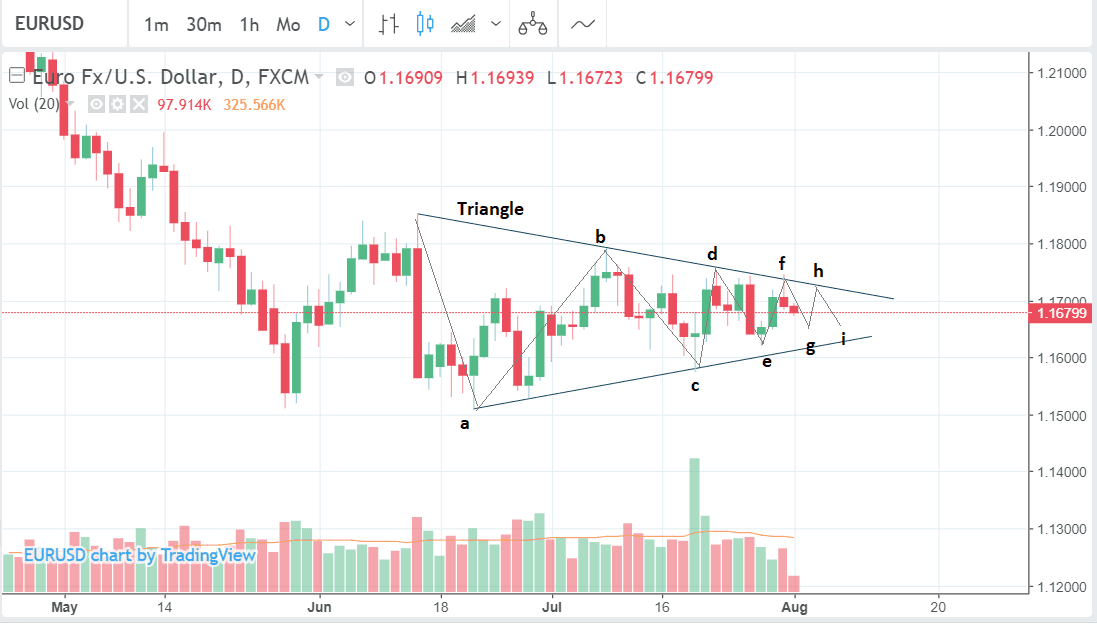
One reason why the 'fake-out' was so compelling, however, was that at that triangle had met its minimum requirement, which is to have formed 5 component waves. this suggested it has completed and was ripe to blow. Since the failure, however, it now looks like this triangle is forming likely into a rare 9-wave extension instead.
The market is now trading back in the triangle at a spot level of 1.1680 ahead of the Fed rate meeting later today at 19.00 B.S.T.
The consensus is for volatility to be muted following the Fed meeting later as the Bank is widely expected to keep rates unchanged. The Fed will also not be releasing any official forecasts and there will be no press conference with chairman Powell to provide commentary or extra data to inform a volatile move.
Yet an alternative interpretation says that if the Fed gives the economy a positive endorsement it could spark some big moves for the US dollar, as it will provide USD bulls with a green light to buy. Such a view is held by Kathy Lien, co-director of BK Asset Management.
"Having just raised interest rates in June, we know that the Fed won’t be making any changes this month. So the big question is whether the dollar will have any reaction to FOMC – and we think it will," says Lien.
Although she sees the greatest gains occurring against the Yen which has been weakened by a more dovish-than-expected BOJ meeting, USD could rise against the Euro as well.
Lien's USD-bullish view fits with the consensus technical picture that EUR/USD is forming a triangle pattern which is probably bearish, as argued by Paul Ciana, a technical analyst at Bank of America Merrill Lynch.
Although it could break in either direction, the relative steepness of the bearish component waves of the triangle suggests a greater probability of a downside, rather than an upside breakout, argues the analyst.
If the pattern resolves lower it should target the 1.12s, "especially while still below the 1.1855," says Ciana.
Looked at through the lens of Elliot wave analysis EUR/USD price action also recommends a bearish forecast.
Such an interpretation suggests the EUR/USD pair is in a Elliot wave (IV) 'triangle' of a five wave bearish pattern with the next move likely to be a wave (V) down, according to Alex Geuta, an Elliot wave analyst at FX broker Liteforex.
The reason he thinks it is in a wave IV is because triangles are usually only ever wave IVs.
The key line in the sand is the 1.1589 level which if broken would signal the next wave of selling in wave (V). This fifth and final wave would have a downside target of between 1.1320 and 1.1439, says Geuta.
Our own technical forecast sees a break below the 1.1575 C-wave lows leading a downside target at 1.1360.
Elliot waves are cycles of buying and selling, of rising and falling prices, which are composed of 5 smaller waves numbered 1-5, or labeled using Roman numerals, as in I, II, III, IV, and V.
Waves 1,3 and 5 move in the direction of the dominant trend whilst 2 and 4 represent corrections. Wave 3 is almost always the longest and the strongest.
After a 5-wave pattern has finished the market corrects back in a shallower counter-trend move labeled A,B, and C.
Advertisement
Get up to 5% more foreign exchange by using a specialist provider to get closer to the real market rate and avoid the gaping spreads charged by your bank when providing currency. Learn more here


