Pound's Uptrend against South African Rand Intact Suggest Studies, Shock Contraction in SA Manufacturing Weighs

Image © Adobe Images
- Rand continues weakening after poor manufacturing data and macro risks weigh
- Charts show conflicting signals although GBP/ZAR trend up
- The main release for ZAR is GDP data for Q2
The Pound-to-Rand exchange rate is trading at 19.1840 at 15.05 B.S.T. on Monday, up from the 19.0634 close of the previous week.
Disappointing manufacturing activity data for both the UK and South Africa, out on Monday morning, weighed on both currencies, however, the data for the Rand was worse as it showed a full-scale contraction, rather than just a slow-down in the rate of expansion, as did the UK data.
"August’s PMI came out at 43.4, markedly down on July’s reading. The result was primarily underpinned by a sharp fall in new sales orders in August, which in turn propelled a notable decline in business activity. We had not anticipated such a dramatic decline, following July’s positive reading of 51.1. Unfortunately this result does not bode well for the manufacturing sector in Q3.18," says Lara Hodes, analysts at Investec in Johannesburg.
GBP/ZAR is rising in an uptrend as the Rand continues devaluing on emerging market (EM) contagion risks triggered by the collapse of the Turkish Lira, the strengthening Dollar and concerns US president Trump will go ahead with widening tariffs on a further $200bn of Chinese imports.
Concerns about the introduction of a policy of the forced expropriation and redistribution of land in SA which weighed on the Rand earlier in the year, however, have eased after the policy was withdrawn yet new risks are emerging as the next general election in H1 2019 draws near.
Advertisement
Get up to 5% more foreign exchange for international payments by using a specialist provider to get closer to the real market rate and avoid the gaping spreads charged by your bank when providing currency. Learn more here
Technical Considerations
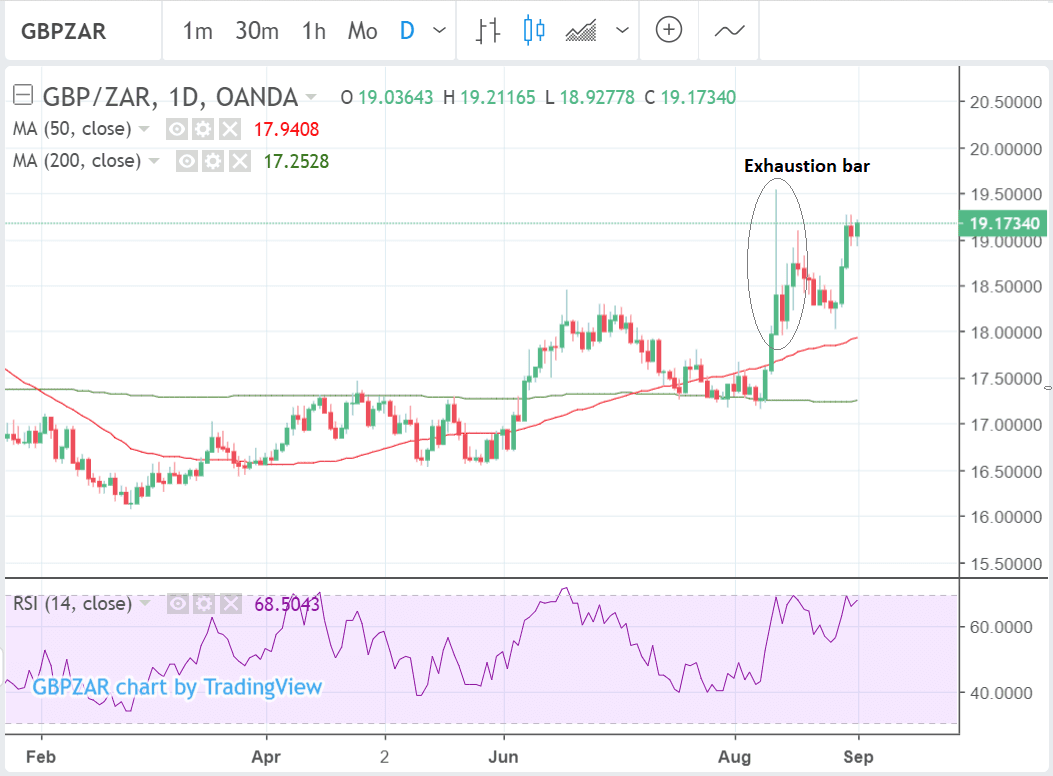
Although GBP/ZAR formed a long, bearish, exhaustion bar on August 13, a high probability signal that the market is going down, it actually, unexpectedly, went up, and this may be one of the few cases in which the exhaustion bar gave an incorrect signal.
Although the short-term trend is up, the existence of the exhaustion bar on the daily chart provides a conflicting signal and makes us cautious about trying to forecast the near-term direction of the exchange rate with any degree of confidence.
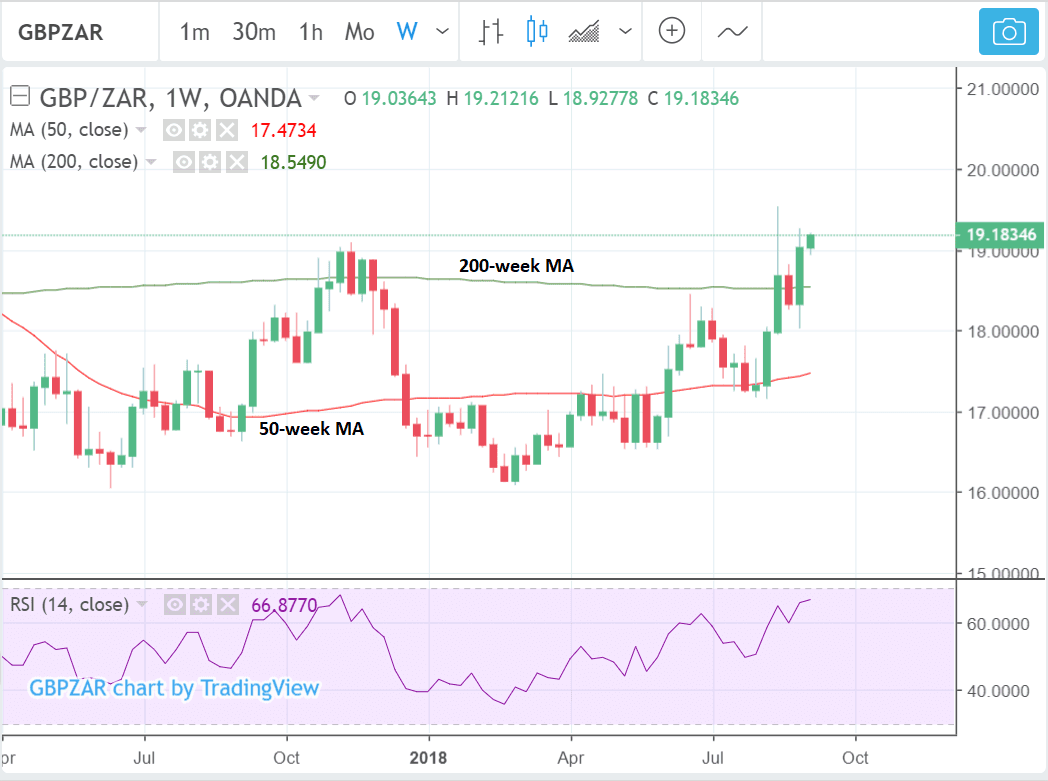
The weekly chart is looking more bullish after the exchange rate broke above the November 2017 highs and the 200-week moving average (MA):
However, weekly studies are longer-term in nature than daily studies, therefore the gains that are being advocated here might be a while in coming.
SA GDP Data Ahead
The main release for the Rand in the week ahead is GDP data for Q2, which is expected to show a 0.6% rise from -2.2% in Q1 when it is released at 10.30 B.S.T on Tuesday, September 4.
"Key available data releases for Q2.18 point to a weak GDP outcome, although the country may avoid a technical recession by a fine margin," says Hodes.
Looking at the components its easy to see why growth may marginally miss negative growth.
Heavy industry and mining narrowly missed contraction in Q2 after recording growth of 0.9% quarter-on-quarter, on a seasonally adjusted basis (qqsaa).
"Agriculture contracted, however, as did trade, and "the economy is operating against a backdrop of mounting supply driven inflationary pressures and relatively subdued activity," says Hodes.
On top of the other broader external risks mentioned above the outlook does not bode well for an appreciation of the Rand.
Advertisement
Get up to 5% more foreign exchange for international payments by using a specialist provider to get closer to the real market rate and avoid the gaping spreads charged by your bank when providing currency. Learn more here


