USD/JPY: "Market Doesn't Like 111.00 Big Figure" says Hantec Markets’ Perry

Image © Goroden Kkoff, Adobe Stock
- USD/JPY Stalls at 111.000 and ranges
- Overall trend still bullish in 2019 however
- Break above 111.35-60 could give ‘green light’
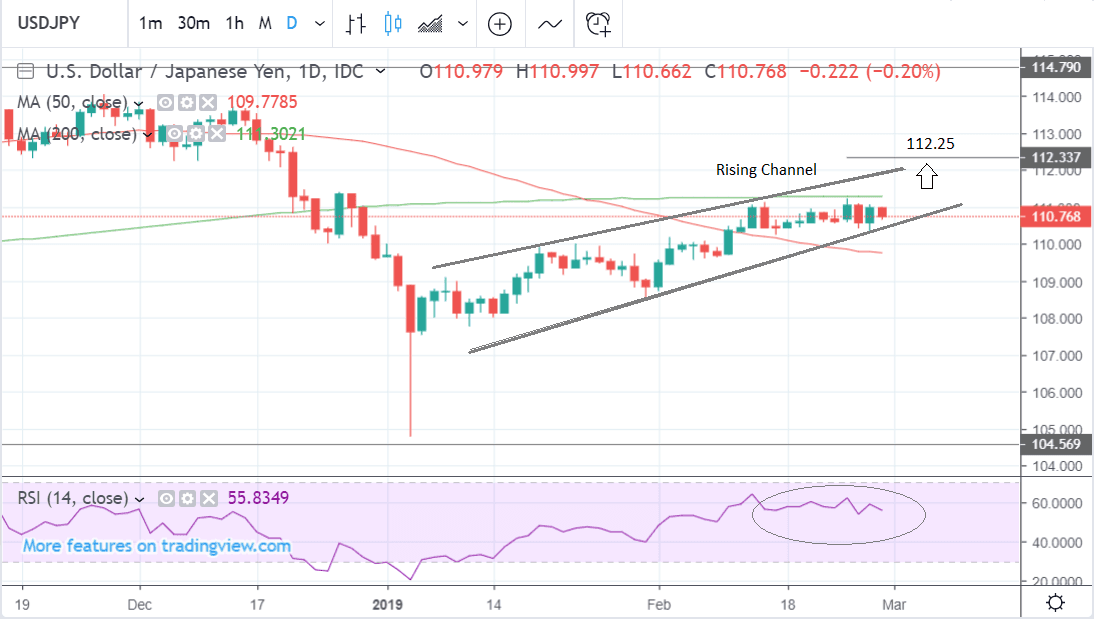
The Dollar-Yen exchange rate (USD/JPY) has been recovering steadily in a rising channel since the January 3 lows and has now arguably established a short-term uptrend.
It is broadly favoured to continue given the old adage that ‘the trend is your friend’, but recent sessions have seen the pair stall at 111.000 and this is raising doubts.
The market “doesn't like big figure 111.000” according to Richard Perry, market analyst at FX broker Hantec Marekets.
“It seems as though every time it gets to 111 big figure it just comes back again. It seems to be a bit of a barrier, certainly in the last few sessions, anyway.”
Yet Perry acknowledges that the market is trading with a “positive bias” alluding to the uptrending channel, and is tipped therefore to go higher.
“You have this uptrending channel in place on USD/JPY, the market is just sort of consolidating within that, really.”
The recent sideways action has been between a floor at 110.25-35, with “markets tending to buy at that level” according to Perry, and the range highs at 111.25-35.
Intraday charts which show the recent range in more detail give no clue as to which direction it will finally breakout in and it is currently “neutral”. A break below 110.000 would prove bearish and open the way to further downside.
“Unless you get a break above 111.35, which is the ‘big pivot’ I can’t really see this gaining too much direction,” says Perry.
Our own chart analysis points a similar picture. We also note the uptrending channel since the January lows and the recent slowdown in bullish momentum.
The 200-day moving average (MA) at 111.30 is the real reason the “market doesn’t like big figure 111”, since major MAs tend to attract short-term sellers who fade the trend, in anticipation of a pull-back.
Given the position of the 200-day we would ideally wish to see a close on a daily basis above it or a break above 111.60 on an intraday basis for confirmation the pair was continuing higher.
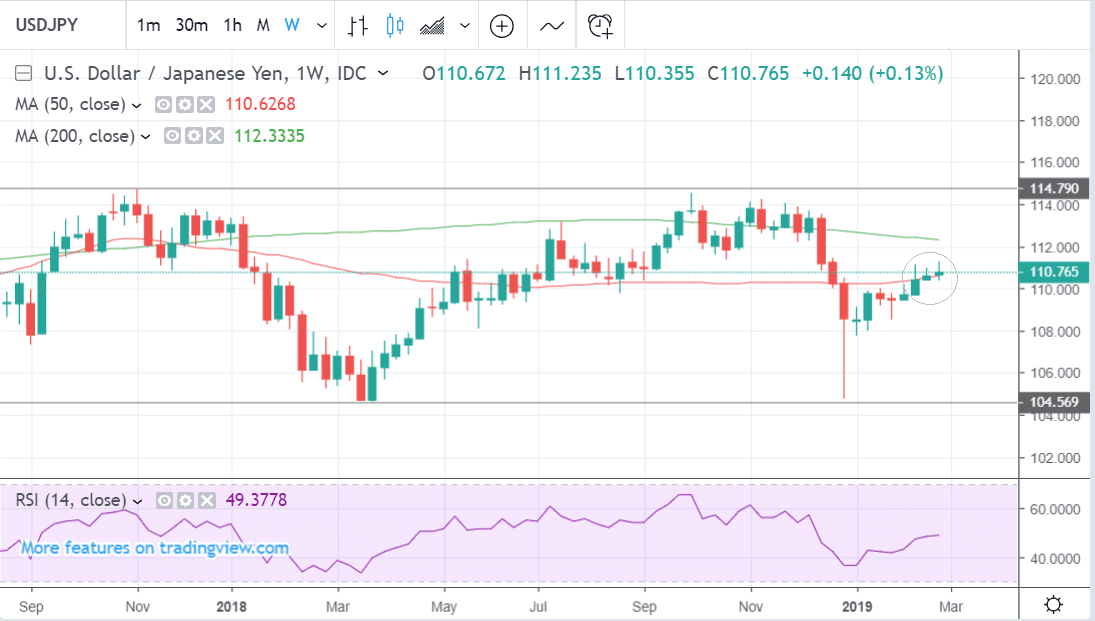
Such a move would probably not go that far, however, before encountering further resistance from the 200-week MA at 112.25-35, which constitutes our upside target for the pair.
The weekly chart shows how the pair is trading in a broader range between 104 and 114, and how it is in a ‘stranglehold’ with the 50-week MA, providing further explanation for why it has stalled over recent sessions.
The monthly chart has a decidedly bullish tone after the pair stopped and reversed right on the 200-month MA in January.
The quick turnaround created a strong bullish hammer candlestick pattern in January which has been enhanced by a bullish follow-through in February. These two in combination suggest a higher chance of a reversal higher and the expectation of higher prices to come.
Time to move your money? Get 3-5% more currency than your bank would offer by using the services of foreign exchange specialists at RationalFX. A specialist broker can deliver you an exchange rate closer to the real market rate, thereby saving you substantial quantities of currency. Find out more here.
* Advertisement


