Are Technical Analysts Overly Bearish The Pound-to-Dollar Rate?

Image © Rawpixel.com, Adobe Stock
- Most technicians see further downside as more likely
- GBP/USD has also formed a bearish candle in the sellzone
- Other indicators tell a different story, cautions against over-bearish stance
Technical analysts are for the most part bearish the Pound-to-Dollar rate - perhaps justifiably.
The charts are showing weakness on the whole, for sure, but at the same time some bullish signs also appear to have been overlooked.
That both sides of the pair have central bank meetings scheduled in the next 48hrs adds further uncertainty to the outlook as these meetings can cause huge volatility.
Whilst analysts had been upbeat about GBP/USD after the exchange rate bottomed just below the key 1.3000 level on July 19, the bounce has since run out of juice and several signs are even indicating that the pull-back may be about to precede another leg down, as the dominant downtrend resumes.
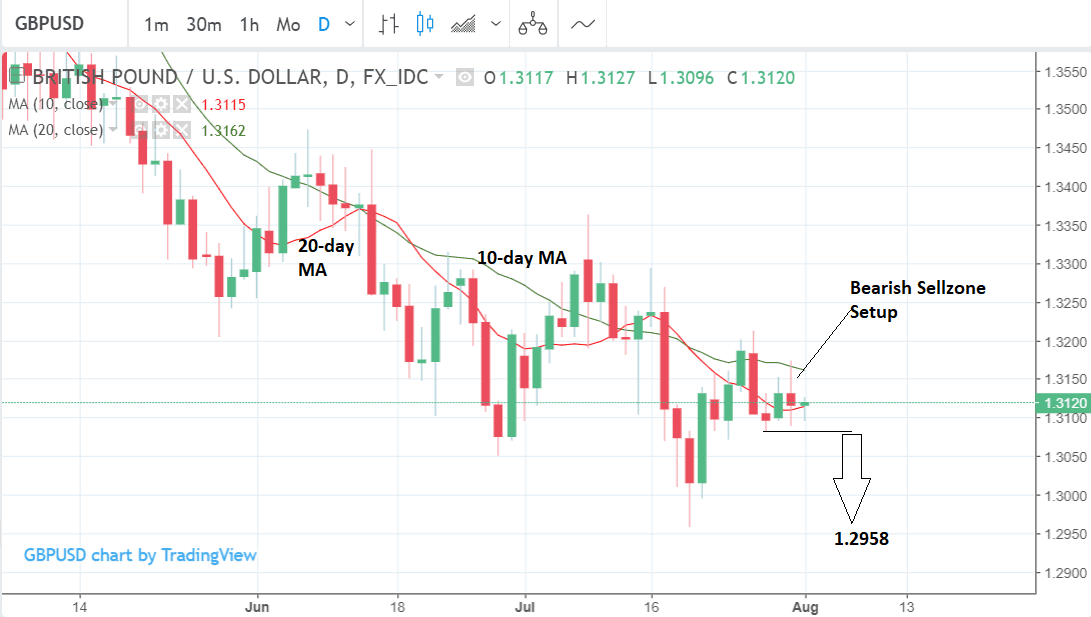
The pair has pulled back into what is commonly known as the 'sellzone' - the area in between the 10 and 20 moving averages (MAs) - which traders says is an optimum point at which to short an asset in decline.
The final confirmatory signal for shorting a pull-back in the 'sellzone' is for the pair to form a bearish candlestick in the zone, which is also the case with GBP/USD.
Although the candlestick is not as bearish as it could be, it does look enough like a bearish shooting star to raise warning signs. Although technically more like a doji, which is more neutral, it is a bearish doji and thus fulfils the criteria for a signal, albeit only just.
Nevertheless, a break below the bearish doji's lows and the 1.3082 level, would probably be sufficient to give the green-light to sellers and see a resumption of the downtrend to at least the 1.2958 lows.
Other analysts are also bearish.
"Daily techs send negative signals as momentum is weak and falling MA’s are in bearish setup," says Windsor Brokers.
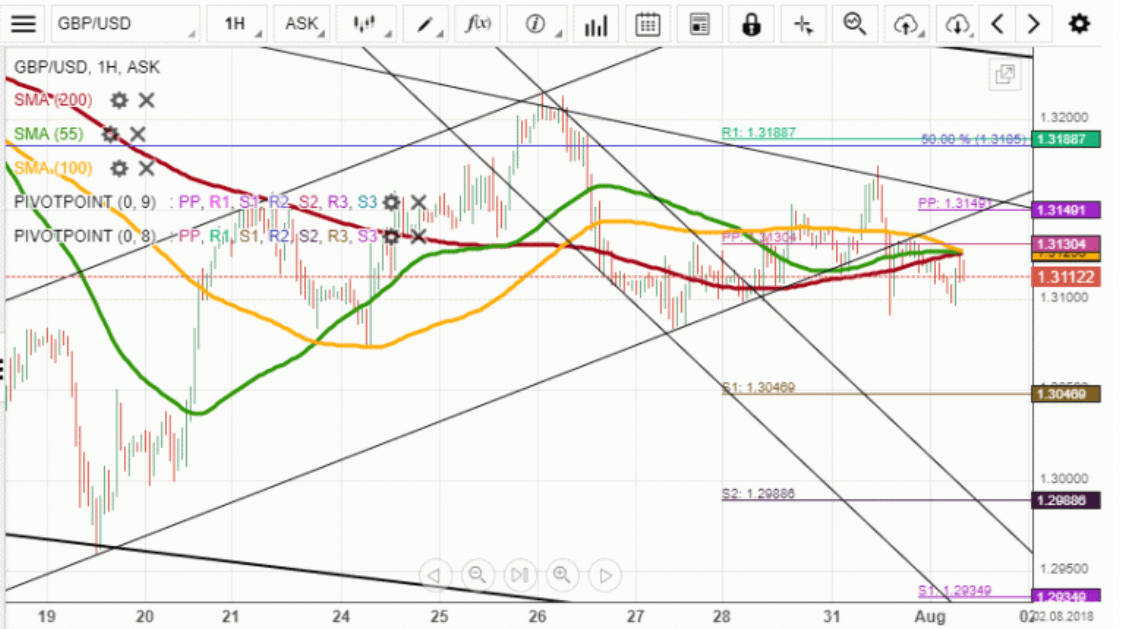
Analysts at Dukascopy note how the pair has fallen below a key resistance cieling at 1.3160 made up of a "short-term trendline" and a bunch of moving averages, which makes it more likely it will resume selling off.
"Technical signals are mixed today. However, the rate moving below this strong support cluster does suggest further decline in this session. A possible downside target is the weekly S1 at 1.3040," says Dukascopy.
Despite all this bearish evidence we are less certain the pair is going lower, and whilst not bullish either we note positive signs.
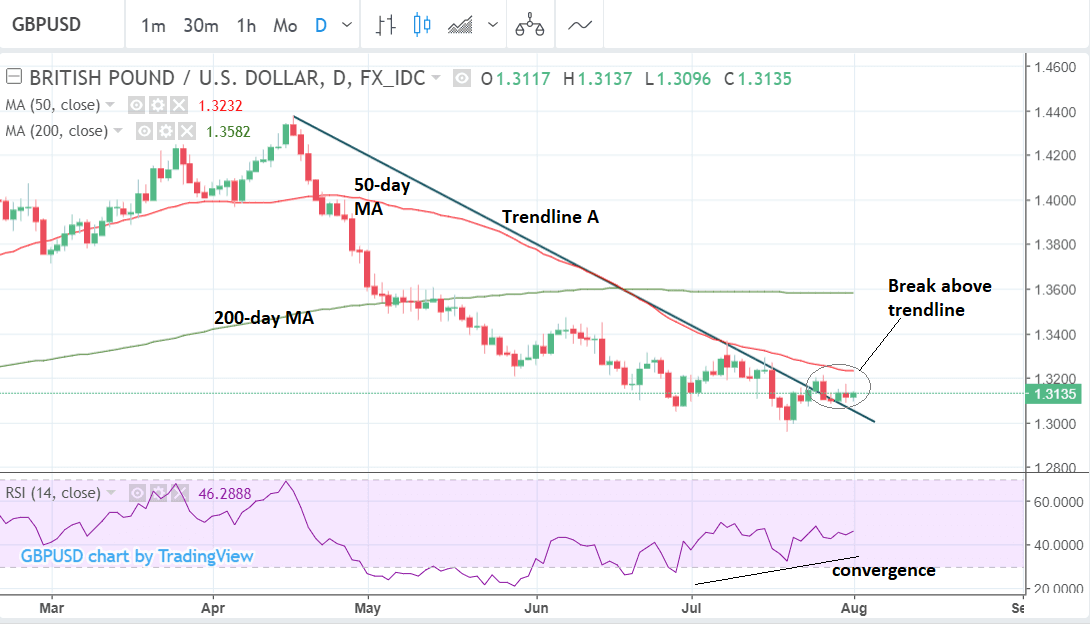
The main sign is that the pair has now successfully broken above a multi-month trendline (A) drawn from the April highs.
Although the break was not strong or on high volume, it is still technically a break of a trendline which is an unequivocally bullish indication.
A further sign is that the RSI momentum indicator in the lower pane is converging bullishly with price. This shows downside momentum is weak because it is not falling at the same rate as prices. Convergence is sometimes a sign that the price is about to reverse trend and move higher.
Advertisement
Get up to 5% more foreign exchange by using a specialist provider to get closer to the real market rate and avoid the gaping spreads charged by your bank when providing currency. Learn more here


