Pound-to-Dollar Rate: 1.3049 is the Main Breakdown Level Traders are Watching

Analysis of GBP/USD price charts shows the 1.3049 level is very significant for the exchange rate - a fall below here could finally end the Pound's recent run of good form.
Pound Sterling has been rising against the US Dollar since January where a 2017 low of 1.1987 was printed - the exchange rate is now at 1.3155 but we note that since October the move higher has stalled and sideways action has become the norm.
Does this mean the multi-month rally is over?
Technical studies of the GBP/USD market - which utilises charts - shows an upward-facing trendline is currently of significance in predicting where the Pound-to-Dollar exchange rate might be heading next.
Of late, the exchange rate has been weakening and putting downward pressure on its trendline which is the blue line just under the current market level marked Trendline A, in the chart below:
For those who don't know what a trendline is, it is a line drawn on a chart to highlight the trend - assuming the asset in question is trending.
Trendlines are drawn to clarify a trend either up or down, the usual rule for drawing the line is that it must start at a major high or low and touch one other price point to be valid, however, the more points it touches the stronger the trend.
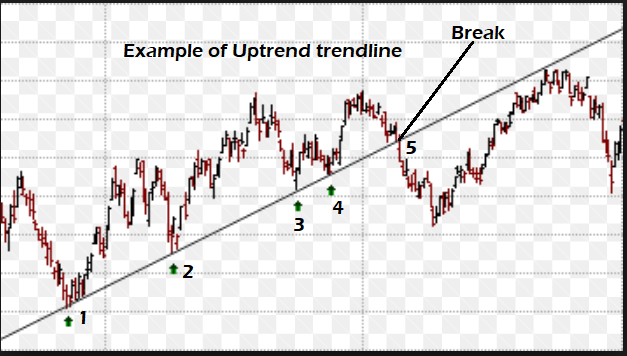
Below is an example of a trendline drawn on an uptrend at subsequent trough lows.

Note how the asset's price comes down and touches the trendline four times in all before it breaks through.
This illustrates an important characteristic of trendlines, which is that they tend to act as support levels so that when prices fall down and touch them they are supported from falling lower and can bounce back up again.
Eventually, however, on the fifth touch, the price falls right through the trendline and moves lower.
When the trendline is broken it provides the analyst with an indicator that the uptrend may have ended.
The second chart shows the same principle in action, but for a trendline on a downtrend on the chart of the share price of Amazon.

Back to GBP/USD, where the exchange rate is resting right on the trendline, the question now is, will it bounce or will it break right through?
"GBP/USD has started to erode the 1.3069/49 support line (trendline) and 2016-2017 uptrend," says Karen Jones at Commerzbank.
The key level is 1.3049 which is "exposed" and, "represents the breakdown point to 1.2830/1.2774, the 38.2% retracement and August low, and the 1.2575 50% retracement."
This basically means that a break below 1.3049 would represent a break of the trendline and a be followed by a move down to the 1.27-1.28s at the very least, possibly even the 1.2575 level which is at a key level called the 50% retracement - basically the midpoint of the previous move.
Mid-points of prior moves tend to have a special significance and can have the same support qualities trendlines have.
The 1.3049 trendline is very significant for the exchange rate according to Jones, who mentions it again as an important longer-term level:
"Long-term trend (1-3 months): A close below the 1.3049 uptrends will be viewed very negatively," says Jones.
Yet the analyst does not rule out the possibility of an upside break as well, arguing that 1.3343 is also a very important level (another 50% retracement) above which, "would trigger a deeper recovery to potentially 1.3417/1.3515. "


