GBP/USD Exchange Rate Rate Jumps Following Below-Par US Inflation and Retail Sales Data

The US Dollar fell steeply on Friday after the release of US Inflation and Retail sales data for June.
The Pound to Dollar exchange rate raced to highs above the magic 1.30 level (view latest rate) in the wake of the data and those watching this market will be hoping a big break to better rates is under way now that resistance has been broken.
But, GBP/USD must close above here to confirm the move.
The Euro to Dollar rate broke above 1.14.
The US data showed a slowdown in both Inflation and Retail Sales for the month, with Headline inflation rising only 1.6% year-on-year when analysts had expected a 1.7% increase and Core Inflation 1.7%. in line with the 1.7% consensus expectation.
The monthly rate of change of inflation also undershot expectations showing no change in June when a 0.1% pick-up was expected.
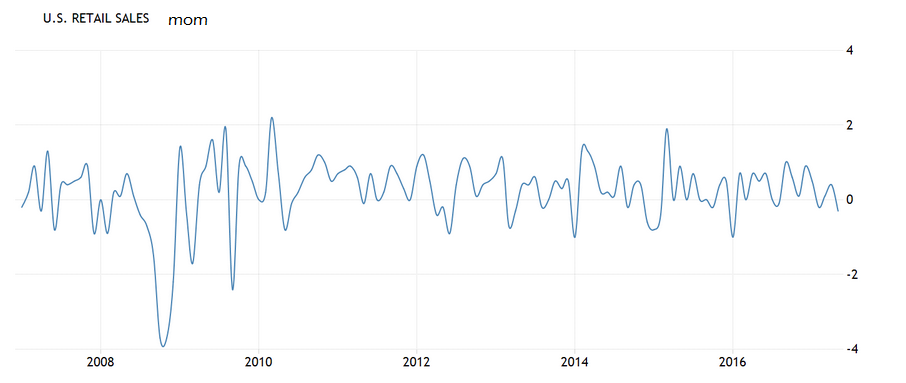
But it was Retail Sales which showed the greater disappointment, declining by -0.2% in June compared to the 0.1% consensus gain and -0.1% previous print in May.
Year-on-year Retail Sales showed a 2.8% gain from 3.8% in June 2016.
Retail Sales ex cars showed an even deeper -0.3% fall against forecasts of 0.1%.
Markets were taken aback by the depth of the decline in retail sales and the rather sombre inflation readings. ‘
As a result of the weaker prints the expectations that the Fed will continue increasing interest rates at the same pace have diminished, pulling the Dollar down with them.
Get up to 5% more foreign exchange by using a specialist provider. Get closer to the real market rate and avoid the gaping spreads charged by your bank for international payments. Learn more here.
"Soft landings are often seen as a virtue, but that's not applicable to a US inflation pace that continues to run below the Fed's desired target. This month registered yet another lacklustre core CPI, up a below consensus 0.1% in June, and you have to go all the way back to February to find a 0.2% rise. Headline CPI was even softer, flat after a -0.1% the prior month. That took the 12-month pace to 1.6%, with core managing to match consensus at a steady 1.7%," said CIBC Economics in response to the data.
On the subject of retail sales they had more to say:
"Retail sales leaned the same way, with a -0.2% headline rate offset to some extent by a two tick upward revision to the prior month, but the "control" group also -0.1%, well below consensus and a weak indicator for June consumption. Bullish for fixed income, bearish for the US$ today," said CIBC's Avery Shenfield.
The lacklustre data makes sense in relation to Janet Yellen’s recent cautious commentary at her house of representatives testimony.
Both headline and, especially core inflation, are slowing, and slowing in a sustained trend, at that.
If we look at the chart of Core inflation below it shows just how bad the inflation problem is – the chart shows core inflation in an entrenched downtrend, measured on a year-on-year basis over a five-year period.
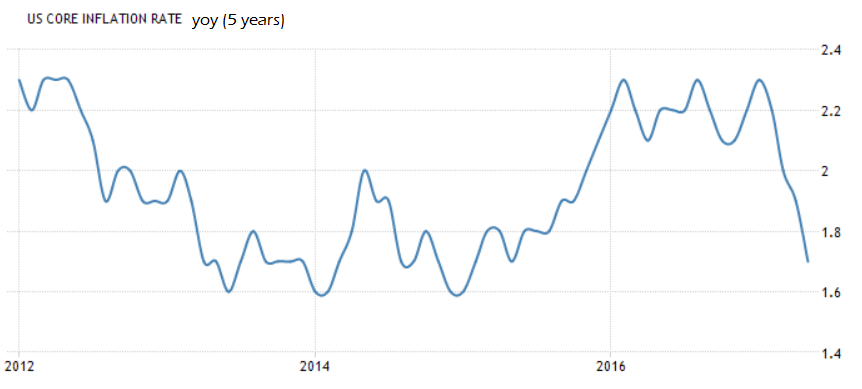
There appears to be no sign of the downtrend in inflation slowing, much less reversing.
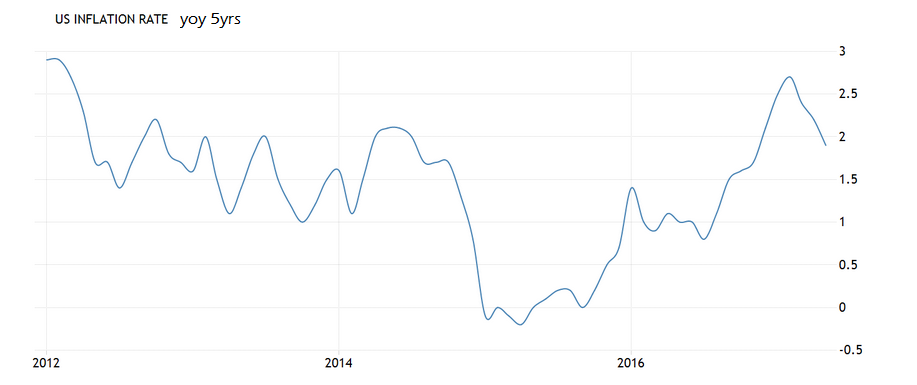
Headline inflation is also showing in decline after a steep rally, as shown in the 5-year historical chart for headline inflation – which includes energy and food inflation – below.
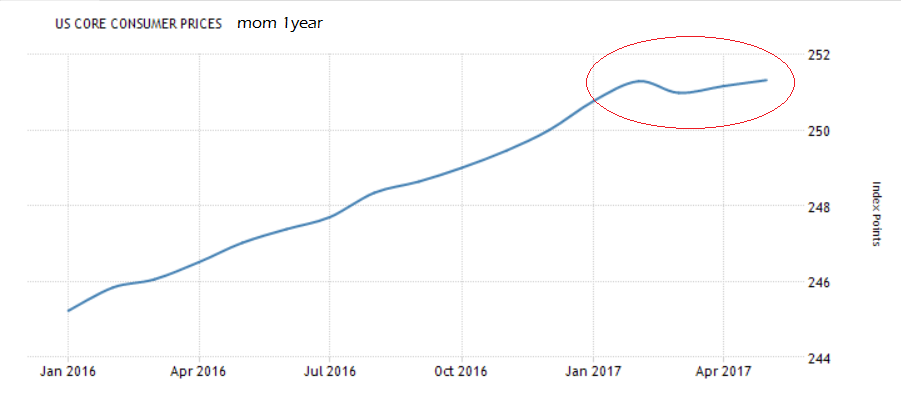
Core Inflation on a month-on-month basis (ie June compared to May) is also showing signs of plateauing.
The 12-month chart below shows how the recent couple of prints marked a stalling of the relentless uptrend previously
Retail Sales Sloping Lower
The poor Retail Sales print was in many ways not surprising looking at the downward sloping curve on the historical data chart, which looks very much like it will continue lower rather than suddenly reverse.
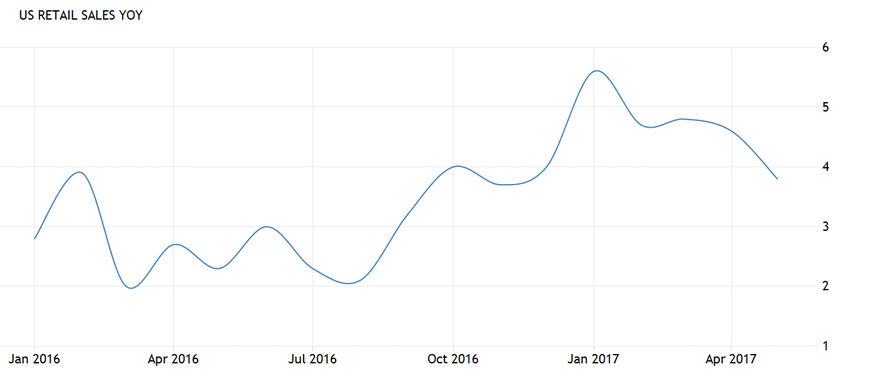
The Retails Sales month-on-month reading is slightly misleading given it mostly oscillates within a range because a sharp increase or decrease in sales is not usually sustainable over a long period.
The exception to this rule was the sharp drop out of the range during the great financial crisis of 2008-9.
