GBP/USD Completing Triangle Pattern

The Pound has risen versus the Dollar on Wednesday following the release of strong economic data from the UK.
Services sector Purchasing Manager’s Index, an important predictive sentiment indicator for the UK economy, showed a much better-than-expected rise to 55.0 than the 55.5 expected; it was the highest reading in 2017.
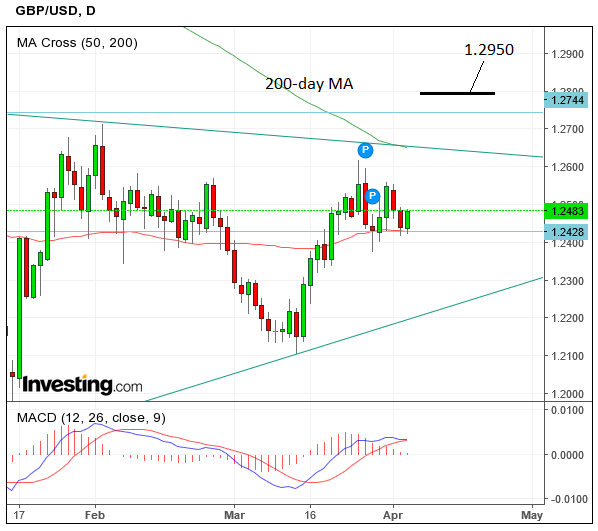
This has propelled the pair higher in a resumption of the short-term uptrend after a brief two-day respite.
There is a higher than 50/50 chance that today (Wednesday) will end above its open level of 1.2440.
Research shows that two down days during an uptrend are more often than not followed by an up-day – as Wednesday is indeed turning out to be.

Triangle Pattern Completing
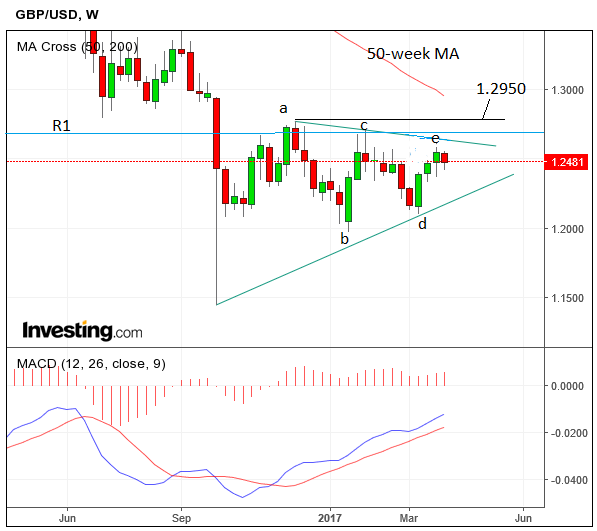
A clear triangle pattern is evolving on the weekly chart of GBP/USD.
The pattern appears to have formed five component waves, which is the minimum number to signal the completion of a triangle.
We are currently completing wave-e.
Once wave-e has finished the triangle will probably breakout – either higher or lower.
There is a lot of resistance above the current market level at the upper border of the triangle, making analysts cautious of forecasting further upside.
The R1 monthly pivot, situated at 1.2743 and the 200-day moving average (MA) at 1.2650 are likely to act as obstacles to the uptrend, so for confirmation of a breakout higher we would ideally wish to see a move clearly above it.
"Intraday Elliott counts are conflicting, but overhead the market faces the channel at 1.2635 and the 200-day MA at 1.2650," says Commerzbank's Karen Jones, who sees a "channel" where we see a triangle.
We think bullish confirmation would come about from a move above 1.2800, with a target at 1.2950 and the 50-week MA.


