GBP/USD Month-Ahead: Pound Still Marginally Bullish

The GBP/USD exchange rate is currently in a sideways trend both on the monthly and the weekly chart.
The top of the range is at around the 1.2800 mark and the bottom at around 1.2000.
The big question is in which direction it will move when it breaks out of this range?
The monthly and weekly charts are suggesting a marginal bias to the upside.
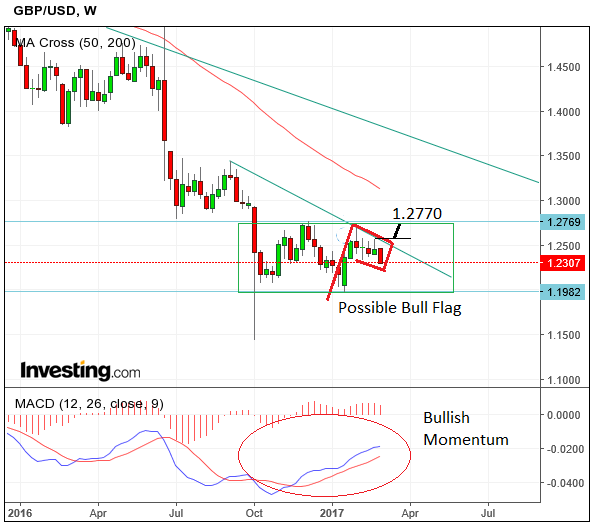
Starting with the weekly chart we see several signs that bulls appear to have the upper hand.

The greatest of these is the form of the MACD momentum study in the bottom pane.
This is showing a strong bullish trend in momentum which suggests underlying strength, as the MACD has continued rising (circled in red) regardless of the ups and downs of the exchange rate.
The next significant bullish sign is the possible bullish flag pattern currently forming.
If this breaks above last week’s highs and pierces the minor trendline in the process the exchange rate will likely rise up the same length as the flag pole again.
Assuming a conservative target expectation, it will probably at the very least reach the 1.2770 range highs, which would provide an initial target for the pair.
Monthly Chart
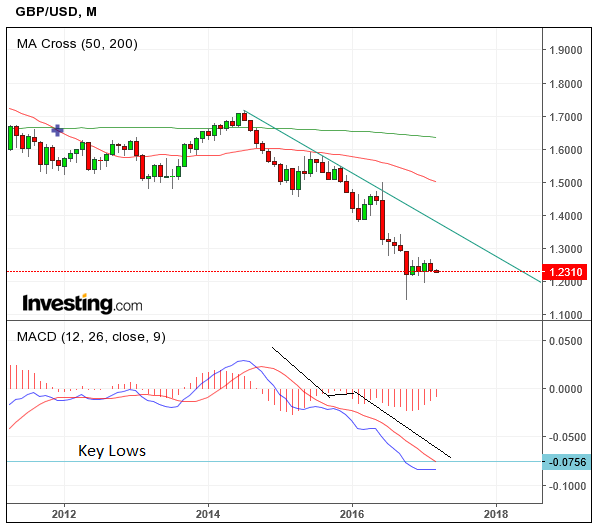
The monthly chart is not providing us with many new clues as to future direction and remains in a strong downtrend, indicating an overall bias to more downside.
Offsetting this bearish view is the existence of a bottoming candlestick in October, which because of its shape and size suggests the downtrend may have completed.
The other main thing to note on the monthly chart is the pattern formed by the MACD, which looks like a measured move or zig-zag.
This suggests the MACD may have completed its downtrend and be reversing.
Although it is early days we see a strong possibility the MACD will cross its signal line and start rising.
This is likely to lead to a simultaneous rise in the exchange rate.
This is the main reason why we see a slight upside bias in the longer-term charts.
The MACD is also at key historic lows (blue line on MACD) which have only been breached once other than now, over the last 25 years, which was during the great financial crisis in 2009 – it is therefore arguably at extreme lows, and therefore overdue a rebound.


