How Low Can the Pound-Dollar Rate Go? Society of Technical Analysts Answers
- Written by: Karen Jones, Society of Technical Analysts
"While below there, we can only assume more pain for the Pound" - Karen Jones, Society of Technical Analysts.

Image © Adobe Images
As the energy crisis and the lack of government continue to take bites out of the British Pound, we are taking a look at the charts to see if they will give an idea of how far the Pound will fall.
First up is Sterling against the mighty US Dollar.
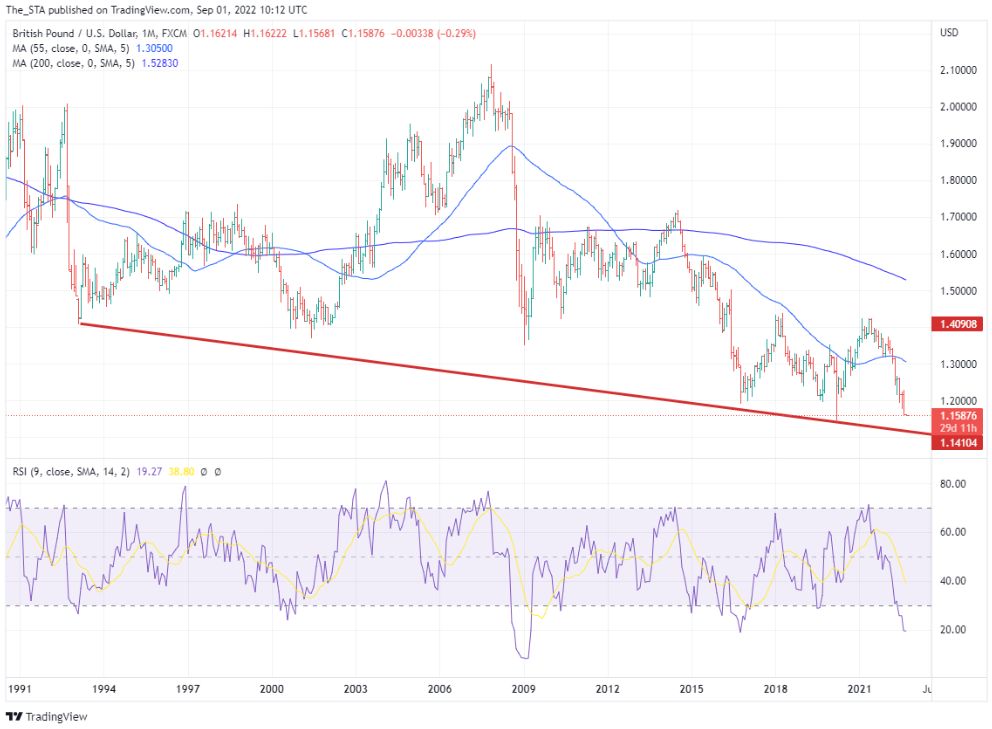
Sterling sinking against the US Dollar is not a recent event - this bear trend has been in place since 2007, but the pace of the down move is gaining momentum and has been doing so for much of the year.
The market peaked at 1.4250 in June 2021 and has now fallen nearly 19% from that high.
The first obvious support is the 1.1410 2020 low followed by the support line from 1993 coming in around the 1.1100 mark.
Fibonacci extensions, from the 2007 peak and the 2014 peak, cluster at 1.1190/70.
The monthly RSI is low at 19, but it has been lower and currently is just confirming the trend.
Above: Pound to Dollar rate shown at monthly intervals.
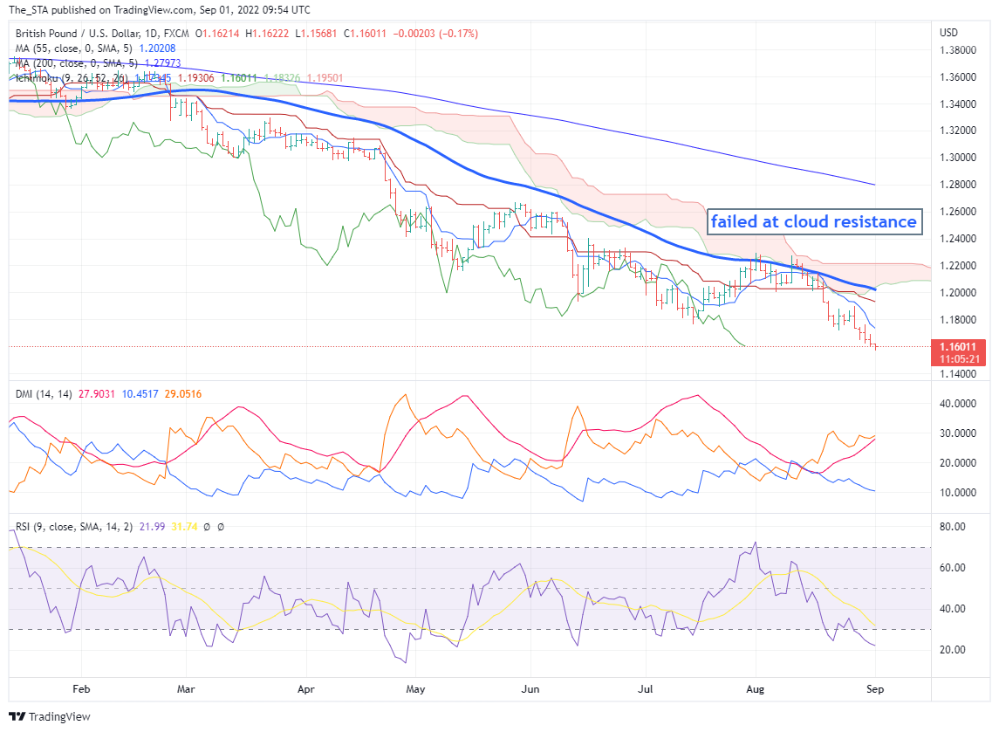
The 9-period daily RSI is low at 22, but it has been lower, and so far, is showing no signs of divergence.
On the topside the July low at 1.1760 offers initial resistance, but the 55-day ma at 1.2021, the cloud resistance spanning between approximately 1.2200 and recent high at 1.2293 offer a dense overhead resistance band.
While below there, we can only assume more pain for the Pound.
Above: Pound to Dollar rate shown at daily intervals.
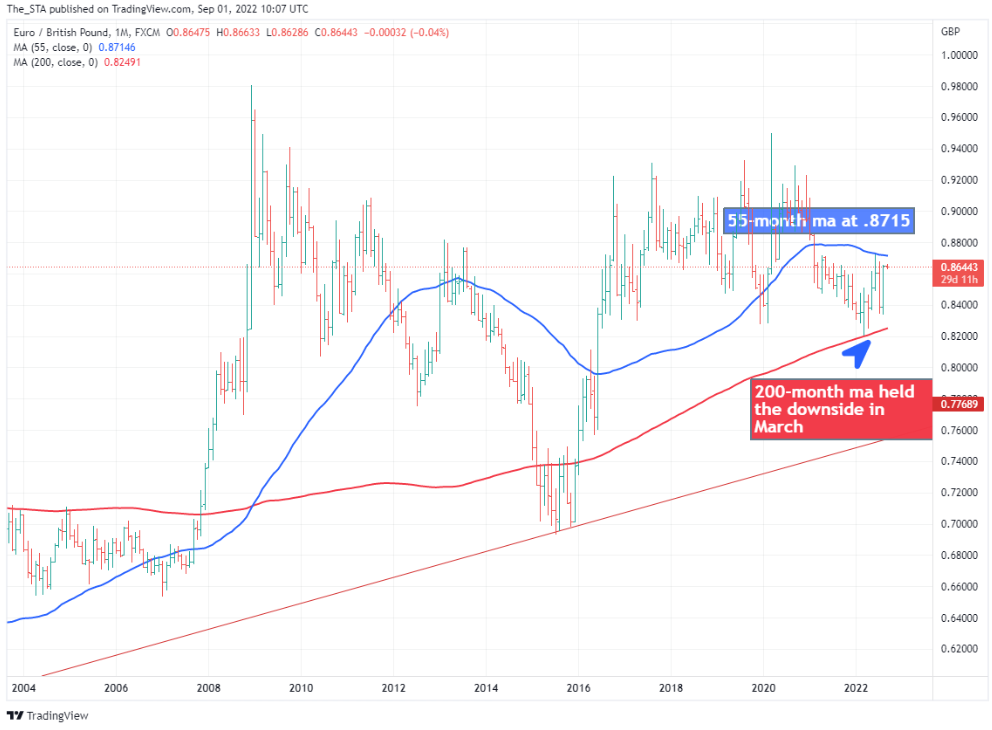
Just as interesting is what is happening on the EUR/GBP chart, which has the .8721 June high in its sights. This is also the approximate location of the 55-month ma at .8715.
This moving average held the up move in June, and we would treat a close above here as likely to trigger another attempt on the resistance above 0.9200 that has managed to keep the Euro in check since 2016.
The Monthly chart also shows that the 200-month ma held the downside beautifully in March 2022.
Above: Euro to Pound rate shown at daily intervals.
Disclaimer:
The information posted on Pound Sterling Live is for informative purposes and is not intended to constitute advice in any form, including but not limited to investment, accounting, tax, legal or regulatory advice. The information therefore has no regard to the specific investment objectives, financial situation or particular needs of any specific recipient. Opinions expressed are our current opinions as of the date appearing on Pound Sterling Live only. All illustrations, forecasts or hypothetical data are for illustrative purposes only. The Society of Technical Analysts Ltd does not make representation that the information provided is appropriate for use in all jurisdictions or by all Investors or other potential Investors. Parties are therefore responsible for compliance with applicable local laws and regulations. The Society of Technical Analysts will not be held liable for any loss or damage resulting directly or indirectly from the use of any information on this site.


