Pound-Dollar Exchange Rate Rally Approaches 13-Year Resistance Line
- GBP/USD back below 1.34
- But momentum continues to favour Sterling
- 13 year downtrend could thwart further gains says Commerzbank
- Credit Suisse technical strategist eyes 1.35

Image © Adobe Images
- GBP/USD spot rate at time of writing: 1.3370
- Bank transfer rates (indicative guide): 1.30-1.3090
- FX specialist rates (indicative guide): 1.3170-1.3250
- Get a no obligation bank beating exchange rate quote here
The Pound-to-Dollar exchange rate is back below 1.34 in mid-week trade amidst a broader recovery in the U.S. Dollar with one analyst saying an historically significant resistance point looms ahead, a rubicon that must be crossed if the broader multi-week trend of appreciation is to remain intact.
The exchange rate peaked at 1.3483 on Tuesday before Sterling's gains were pared back to 1.3377, where we find it at the time of writing in the mid-week session.
"GBP/USD bucked the August trend of weakening and rose over 2% - the highest August rise since 2005. GBP/EUR hit a 10-week high above €1.12 and EUR/USD clinched a fourth monthly rise in a row whilst the U.S. Dollar index hit a new 27-month low," says George Vessey, UK Currency Strategist, Western Union Business Solutions.
While the trend appears to be in favour of Sterling, some near-term turbulence could be in store.
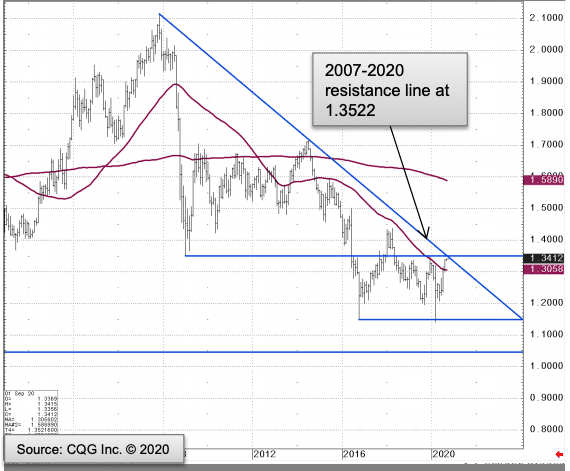
According to Karen Jones, Team Head of FICC Technical Analysis Research at Commerzbank, the GBP/USD exchange rate's rally is due to run into significant resistance in the form of a multi-year downward sloping trend line which could be peppered with market orders with the potential to reverse the pair's rally.
"GBP/USD is approaching a 13 year resistance line," says Jones in a recent briefing to clients.
Above: GBP/USD monthly chart, courtesy of Commerzbank.
"GBP/USD is heading towards the 1.3500/15 the December 2019 high and the January 2009 low. Here we also find the 1.3522 2009-2020 resistance line and we would allow for this to hold the initial test. This is considered to be a major break up point to the 1.4377 2018 high longer term," says Jones.
A break above the trend line would be deemed to be a positive signal for Sterling and advocate for further gains.
Kenneth Broux, a strategist at Société Générale says recent price action on the charts suggest a pause in Sterling's rally against the Dollar is now overdue:
"GBP/USD has approached December peak of 1.3516 and formed a shooting star pattern yesterday; it is not a reversal formation per se but indicates temporary exhaustion in upward momentum. This could prove be an interim hurdle which can give way to a short-term pause however signals of an extended decline are not visible. In case resistance at 1.3516 is overcome, next projection will be at 1.3650/1.3690. First support is located at 1.3270 while August low of 1.3050/1.2980 should now be an important level.
If you are watching the GBP/USD rate and would like to lock in current rates for use in the future - thereby protecting your budget - please learn more about how this can be achieved.
Analysts do tend to look at various levels in the market based on different timeframes, and for David Sneddon, a technical analyst at Credit Suisse, the near-term trend higher could extend to 1.35 given recent market developments.
"GBP/USD has seen a decisive break above its recent range highs at 1.3267 and with the USD weakening sharply and resuming its core bear trend we look for a resumption of the core bull trend here also. Immediate resistance is seen at 1.3447, with much tougher resistance and our core objective seen starting at the 2019 high at 1.3514," says Sneddon.


