Triangle Pattern Forming on GBP/NZD Rate, Hints at Weakness to Come

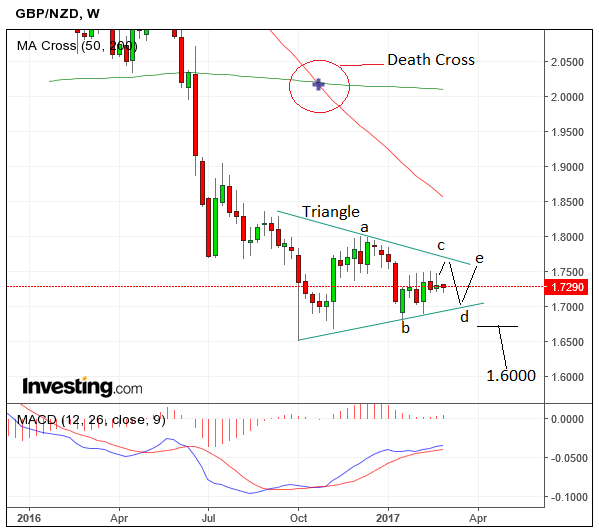
GBP/NZD is forming a triangle with bearish connotations on the weekly chart.
It is currently unfolding the C wave of the triangle, which looks unfinished and will probably move higher, finishing at the topside of the pattern, at around the 1.7750 level.
Triangles usually have five composite waves (a-e) so this triangle is likely to continue unfolding in a broadly sideways trend for several more months until the pattern has completed.
The fact the pair is in a dominant long-term downtrend indicates a higher probability that the triangle will break bearishly rather than bullishly.
Often triangles compromise the penultimate move within a bigger trend, which could mean that there may only be one more wave of selling before the bigger downtrend reverses.downtrend reverses.
A break below the 1.6796 lows would confirm a breakout lower, towards a target at roughly 1.6000, calculated from extrapolating the height of the triangle at its widest point down from the break, and because it is a major round number and therefore is expected to attract disproportionate demand.
Another feature on the chart is the rare Death Cross (circled) formed by the 50-week moving average crossing below the 200-week moving average is a highly bearish sign too, further increasing the probabilities of more downside in the future.


