GBP/NZD Tech View - How Much Lower?
The New-Zealand dollar remains well bid against sterling, despite the RBNZ’s ongoing battle to weaken it, We take a technical tour of the pair to decide how much lower it can go.

The pound is not the only currency to depreciate versus the kiwi – the same effect can be witnessed in dollar, Aussie and euro pairs.
The currency is supported by the fact New-Zealand still has one of the highest interest rates in the G10 and is therefore a target for the carry trade, in which investors make money by borrowing a currency at a low interest rate – such as the euro, or pound for that matter - and selling it to purchase a currency with a relatively high interest rate like the kiwi (of 2.50%) - the carry traders then pocketing the difference.
Regardless of the underlying reasons, which are complex, below we take a look at the charts, and review the technical argumnents for how much further the kiwi rally could go.
GBP/NZD Techs – Forecasting 2.1745
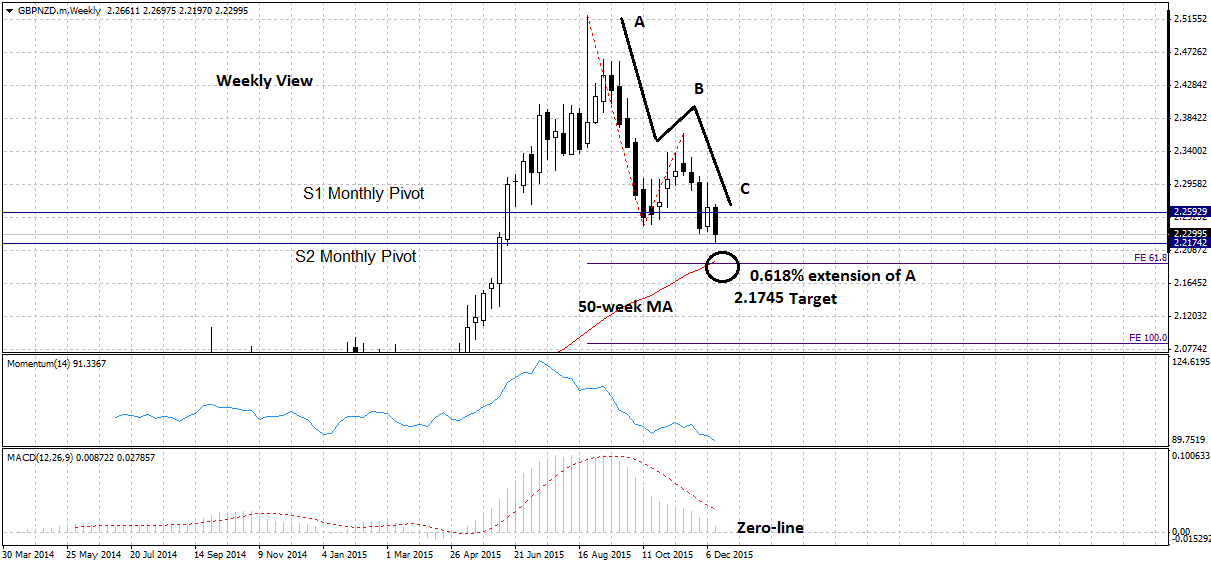
The weekly chart is showing GBP/NZD falling in a three-wave A-B-C corrective pattern within a longer-term up-trend.
The C wave of the pattern appears unfinished as it is normally expected to reach at least as far as a Fibonacci 0.618% of the length of wave A, and it has still not extended that far.
The pair is therefore expected to continue lower until it reaches this extension, which is situated at 2.1745.
This is also where the 50-week MA is situated, making it a strong support level and a highly likely area for a bounce, and possibly even a recovery in the longer-term up-trend.
Momentum is dropping strongly, showing no convergences and supporting the corrective trend lower, and its probable continuation, whilst MACD is at the cusp of moving below the zero-line and signalling a trend reversal from bull to bear, which would also support more downside.

Daily View
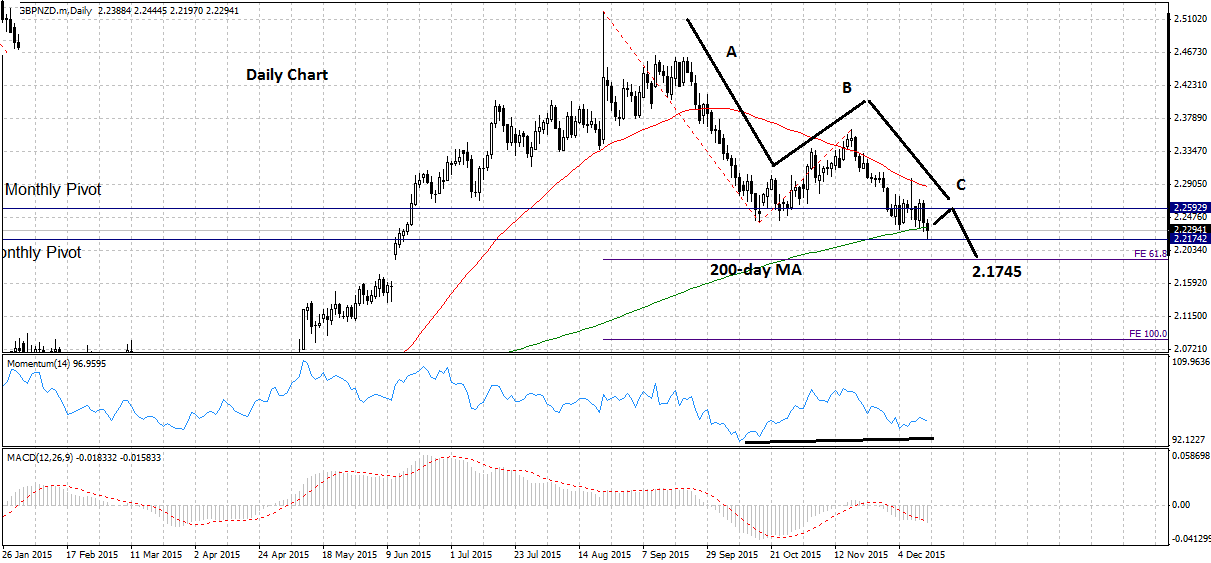
The daily chart provides us with a clearer view of nearer-term technical levels and themes.
Here we see the pair currently encountering support from the 200-day MA today – at 2.2345.
This is normally a major support level where broad trend can sometimes reverse, so there is a possibility that the pair could consolidate on this line of even bounce higher.
The S2 Monthly Pivot situated just below the day’s lows at 2.2174 is providing further support for the pair.
MACD and Momentum are converging bullishly, indicating underlying strength in the market, and further supporting a bounce higher, however, the Monthly Pivot at 2.2590 provides an upside ceiling for the pair, which I ultimately see moving lower eventually.
The strong technical levels need to be decisively breached, however, to give more confidence in the downside projection to the weekly chart 0.618% Fibonacci target at 2.1745.
Ultimately it would require a break below S2, including a 50-point confirmation buffer – so below 2.2024 – for the case to really strengthen for the pair dropping to the target at 2.1745.


