GBP/USD, EUR/USD and USD/JPY: Levels to Watch on Fed Day
- Written by: Karen Jones, Society of Technical Analysts

Image © Adobe Images
Markets seem pretty quiet ahead of FOMC with investors looking for a 75bps hike. It is always good to know where any key support or resistance ahead of numbers so let’s have a quick look at some charts.
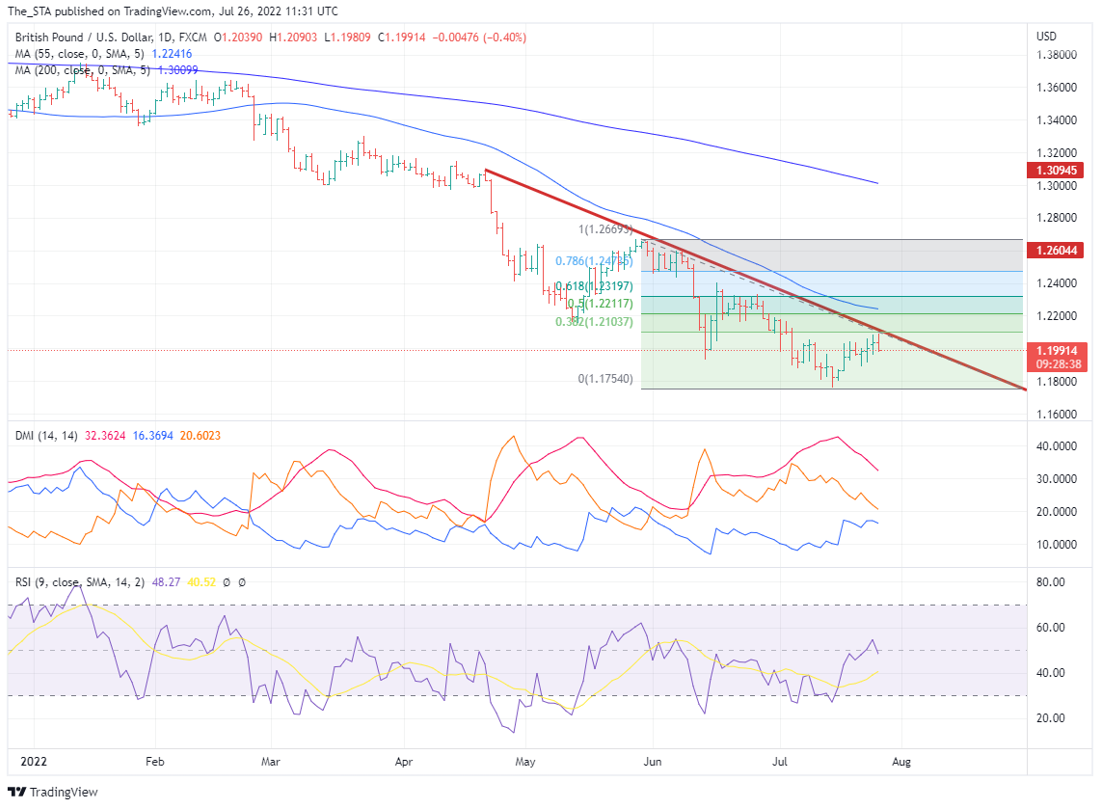
First up is the GBP/USD daily chart.
This has been gaining ground over the past couple of weeks and has now reached tougher resistance in the 1.2090/1.2105 region, which represents a combination of the 38.2% retracement of the move down from the 21 st April high and the 2-month downtrend.
While it holds, we are inclined to view the chart in a still negative light. If you are holding short positions in this one, we would consider tightening up those stops as a break above this band is likely to see a quick spike up towards the 55-day moving-average at 1.2242.
Above: GBP/USD daily chart.
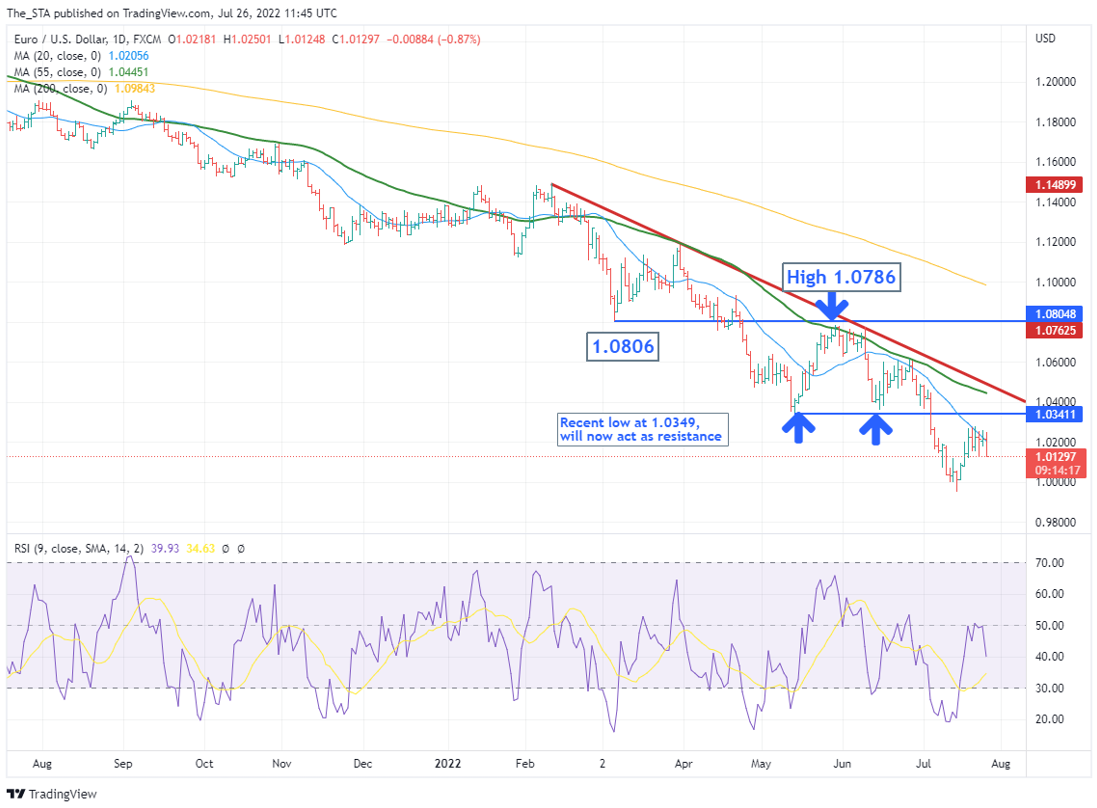
EUR/USD is telling a similar story and is already backing away from challenging the previous May and June lows around 1.0350.
Our bias stays bearish on this one as well, with our attention still on parity for now.
The recent low lies at 0.9952 with the 78.6% retracement (of the move from the 2000 low to the 2008 peak) cutting in at 0.9889 and marking our near-term targets.
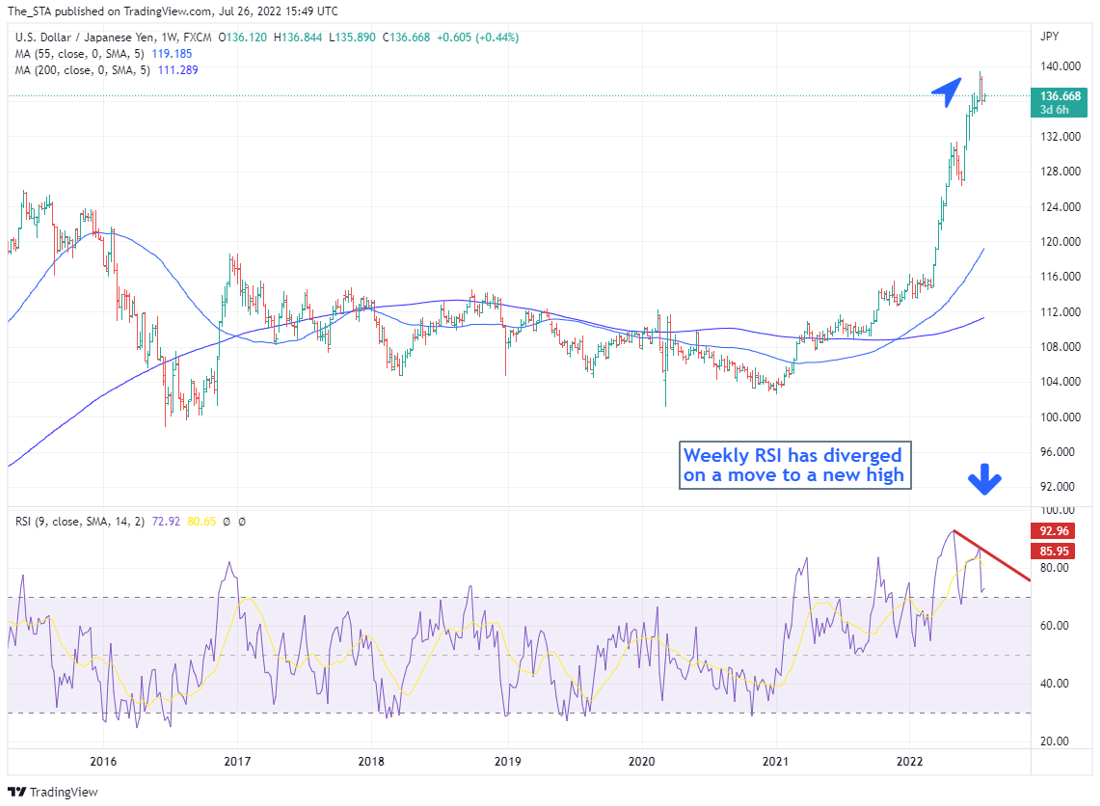
Elsewhere the divergence of the weekly RSI on the USD/JPY charts suggests that 140 handle remains a bridge too far for now.
It is reflecting a loss of upside momentum and we would allow for some further consolidation/some slight slippage on this one.
Dips should find initial support around 134.75, the 4-month uptrend and 55-day ma at 133.40.
The Society of Technical Analysts' next course starts in October. Those wishing to learn more about technical analysis can take a look at the Route to Diploma - Society of Technical Analysts, or sign up here.
Disclaimer:
The information posted on Pound Sterling Live is for informative purposes and is not intended to constitute advice in any form, including but not limited to investment, accounting, tax, legal or regulatory advice. The information therefore has no regard to the specific investment objectives, financial situation or particular needs of any specific recipient. Opinions expressed are our current opinions as of the date appearing on Pound Sterling Live only. All illustrations, forecasts or hypothetical data are for illustrative purposes only. The Society of Technical Analysts Ltd does not make representation that the information provided is appropriate for use in all jurisdictions or by all Investors or other potential Investors. Parties are therefore responsible for compliance with applicable local laws and regulations. The Society of Technical Analysts will not be held liable for any loss or damage resulting directly or indirectly from the use of any information on this site.


 Above: USD/JPY daily chart.


