Bitcoin a "Sitting Duck"
- Exchange rate poised to break out higher as uptrend tipped to continue
- Bitcoin pauses after rallying to the 50-week moving average
- More detailed charts show intraday action has formed a volatile triangle pattern
- Exchange rate poised to break out higher as uptrend tipped to continue
Bitcoin has paused after its strong rally during July, which saw it go from sub-$6000 to a recent peak of $8506.
The pair is consolidating, and intraday charts such as the 15 minute bar chart below are showing the formation of a triangle pattern which often forewarns of a volatile breakout on the horizon, making it a "sitting duck" for traders in the words of one analyst.
"Bitcoin price is trading at the narrow end of a short-term contracting triangle, likely to culminate in another breakout to the upside," says John Isige, an analyst at FX Street.
The cryptocurrency peaked, fell back, and has now found support at the 61.8% retracement of the previous rally between 7,700 and the 8,500 highs, a level considered by experts to hold a special significance on charts being extra supportive.
The effect of mixed cross-currents in the exchange rate is that "the trend is neither bullish or bearish and the price is a sitting duck waiting for either the bulls or the sellers to attack," says Isige.
If the triangle eventually breaks out higher, as it is marginally more likely given the preceding trend was bullish, the end target for the breakout is likely to be at $8565.
This target is 61.8% of the height of the triangle at its widest point extrapolated higher from the break - the usual method used by analysts to forecast triangle breakouts.
A break above wave-d highs at $8308 would be required for bullish confirmation.
Triangles are usually composed of 5 waves, labelled a-e, and must have 5 waves as a minimum before they are complete. The triangle on BTC now has 5 waves and so is probably close to breaking out.
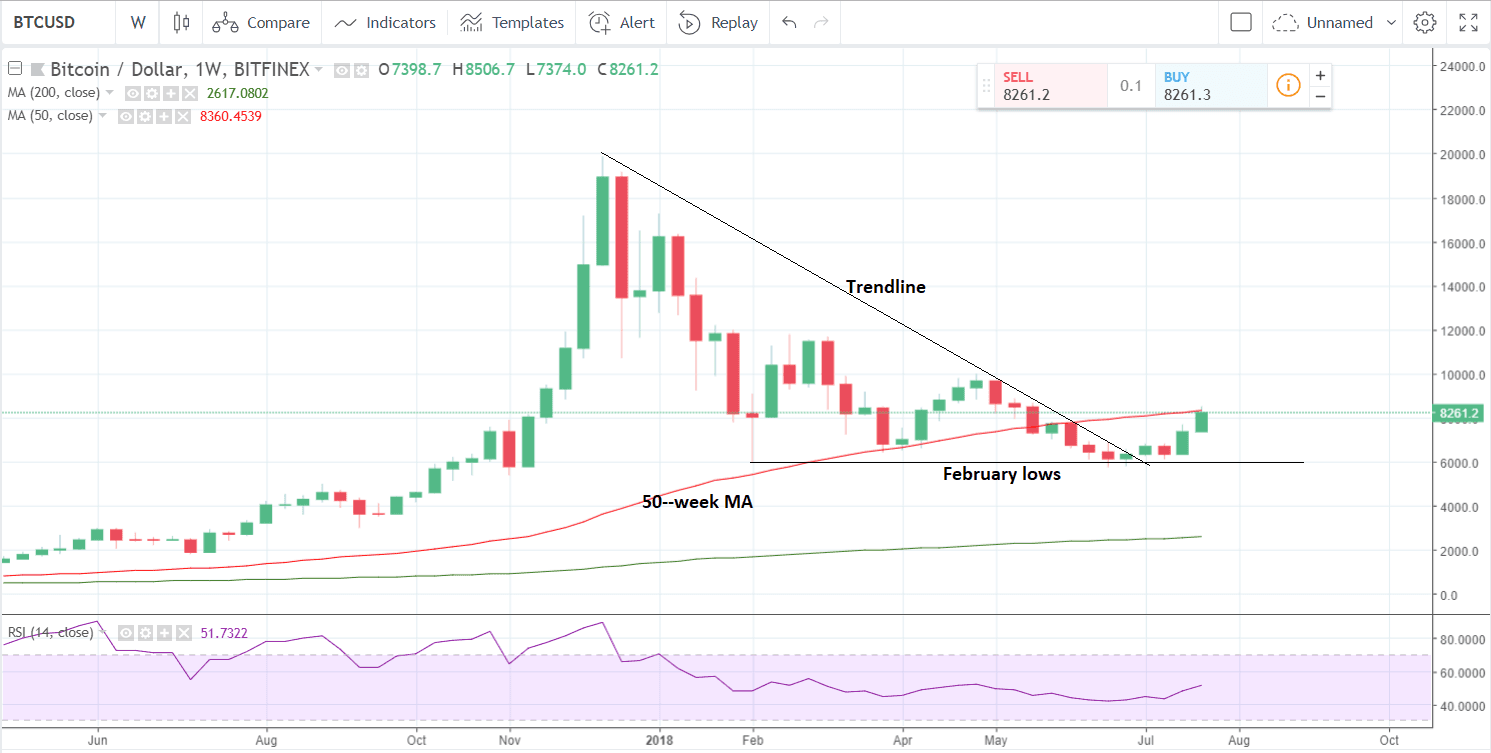
Longer-term the pair has broken above a key-trendline drawn from the $20k peak in 2017, which is an extremely bullish sign for the coin.
It has just touched the 50-week moving average (MA), however, which is likely to act as an obstacle and is probably the reason for the pull-back which has led to the formation of a triangle on the 15 minute chart above.
Large MAs, such as the 50 and 200 period MAs, are often the location of pull-backs, corrections or even wholesale reversals of the trend. It is too early to say what will happen at this MA but early evidence points to a weak pull-back before a resumption of the uptrend.
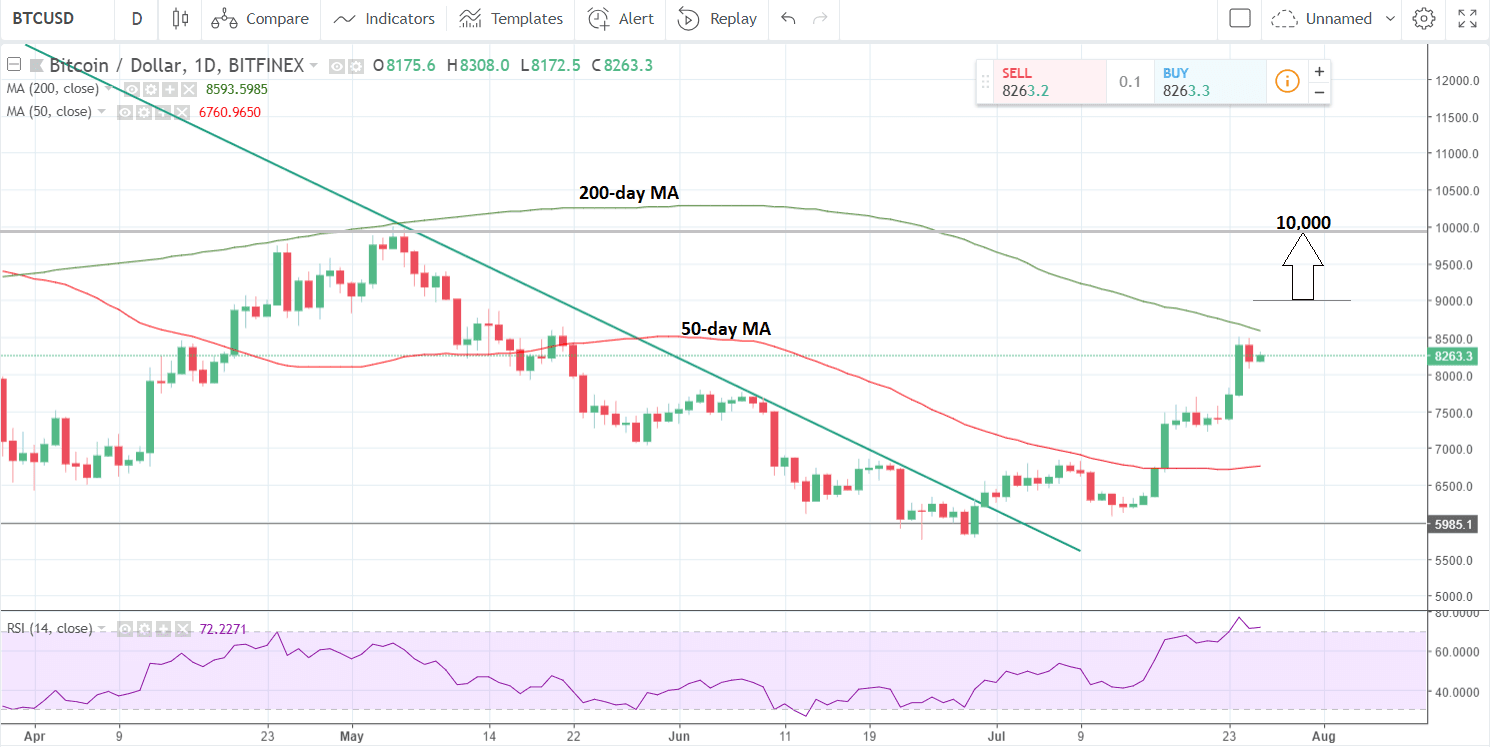
The daily chart below shows the 200-day MA located just above the recent highs and also likely to offer substantial overhead resistance to further gains.
Assuming the price can vault these levels, it will probably continue higher. A break above $9000 would almost certainly confirm a continuation higher to a target at $10,000 and the February highs.


