Pound-Swiss Franc Exchange Rate Completes Technical Pattern and Risks Stalling for a Time

Image © Albert Czyzewski, Adobe Images
- GBP/CHF meets target after rising in strong uptrend
- Risk of a pullback and sideways market evolving
- Main driver of Swiss Franc is risk sentiment
The Pound-to-Franc exchange rate is trading at around 1.2760 at the time of writing after rising 1.38% in the week before. Studies of the charts show a risk of a pullback before the pair continues its new uptrend.
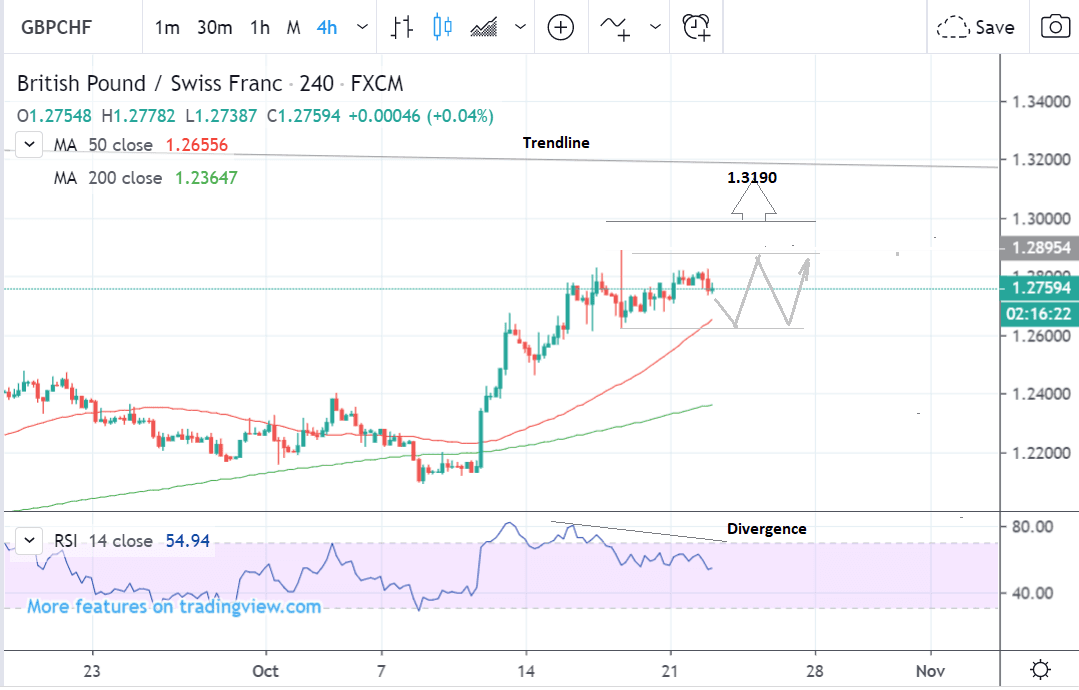
The 4 hour chart - used to determine the short-term outlook, which includes the coming week or next 5 days - shows how the pair was rising up sharply before but has steadily lost some strength over recent sessions.
The exchange rate is diverging bearishly with momentum, as measured by the RSI indicator, which suggests an increased risk that the pair may pullback or enter a sideways range, between 1.26-1.28 perhaps.
The established trend is bullish so a continuation higher is favoured, but tough resistance from a major moving average just above the exchange rate is acting like a barrier to further upside.
Only a clear break above, confirmed by a move above 1.3000 would give the 'green light' to a continuation higher to the next target at 1.3190 and the downsloping trendline.
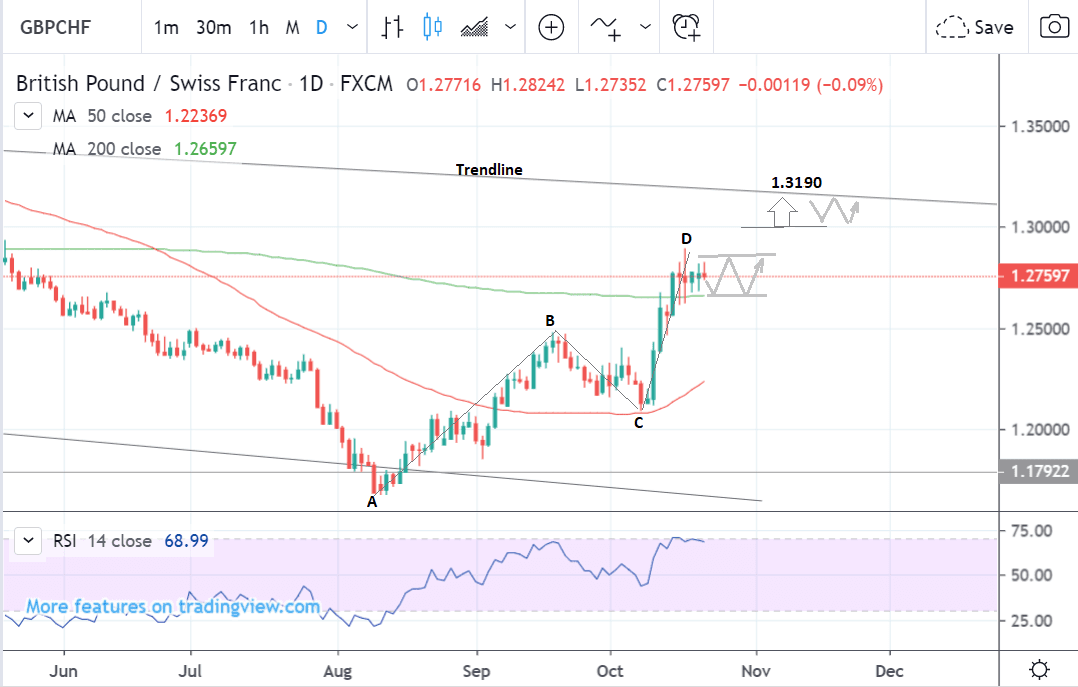
The daily chart shows the completion of a bullish price pattern which has formed as the pair has rallied up from the October 10 lows.
This pattern is known as a ‘measured move’ or ABCD. It is composed of three waves - the first and third of which are usually of a similar length, as is the case with the one on GBP/CHF.
Now the measured move is complete, there is a heightened risk of a pullback as traders with bullish bets take profit on their positions.
A break above the key 1.3000 rubicon level would be required to reinvigorate the bull trend and lead to a move up to circa 1.3190 and the trendline.
This is then likely to act as a ceiling blocking further gains and lead to a possible pullback or consolidation.
The daily chart is used to give an indication of the outlook for the medium-term, defined as the next week to a month ahead.
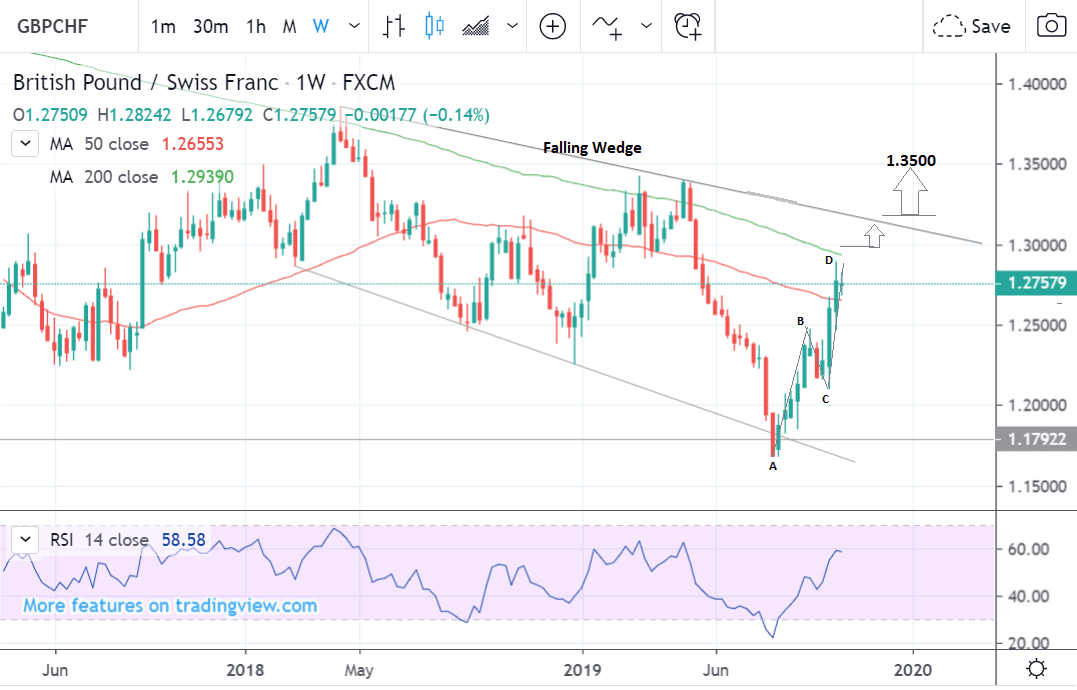
The weekly chart shows the pair is rising up within a falling wedge-shaped pattern.
It also shows how the 200-week Moving Average (MA) at 1.2939 is blocking further gains.
A clear break above the MA, however, would open the way to further gains up to a target at at the top of the wedge.
A clear breakout from the wedge pattern would be a very bullish sign and probably lead to a volatile move higher to an initial target at 1.3500.
The weekly chart is used to give us an indication of the outlook for the long-term defined as the next few months.
Time to move your money? Get 3-5% more currency than your bank would offer by using the services of a specialist foreign exchange specialist. A payments provider can deliver you an exchange rate closer to the real market rate than your bank would, thereby saving you substantial quantities of currency. Find out more here.
* Advertisement


