The Pound-to-Australian Dollar Rate: ‘Loudspeaker’ Pattern Seen on Charts, Further Short-Term Gains Possible

Image © Andrey Popov, Adobe Stock
- Pound hits 5-month high vs. Aussie Dollar
- Short-term gains seen, but mid-term uncertain
- 1.89-90 key level to watch
The Australian Dollar slumped on Wednesday following the release of data showing the economy slowing down by a greater-than-expected degree in Q4. This led the Pound-to-Australian Dollar rate to rise to the 1.87s with a 5-month high at 1.8743 being secured.
What do we make of the outlook based on this aggressive price action? Our technical studies suggest the outlook is short-term bullish, favouring a continuation higher to around the 1.89-1.90 level before any risk of a substantial move lower.
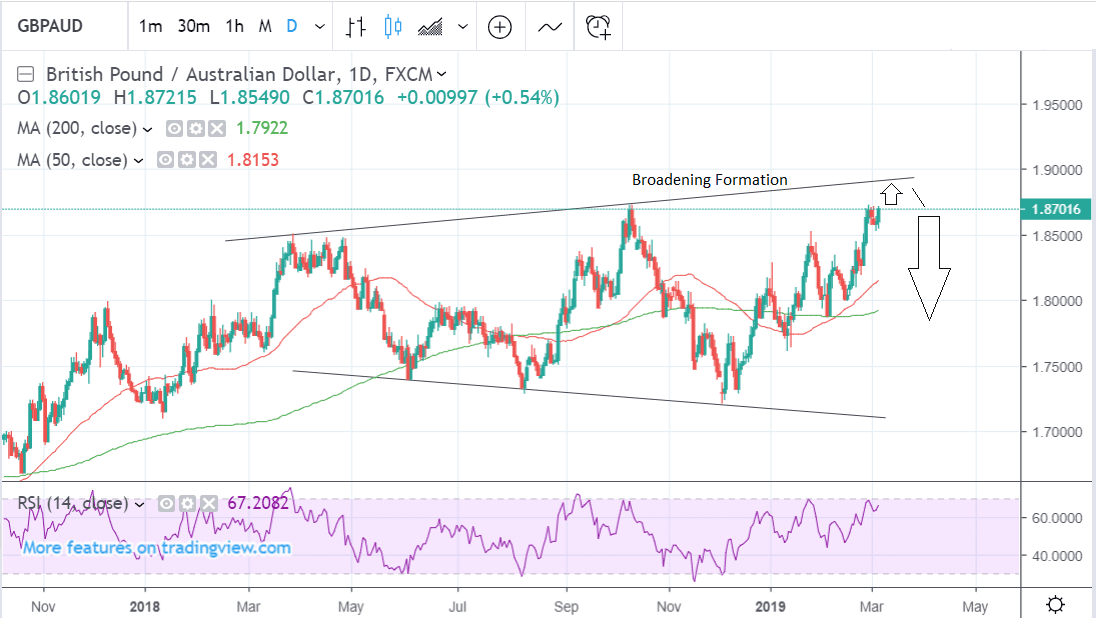
Over the medium-term (coming weeks), the outlook is however less certain, as the pair may have formed a technical chart pattern called a ‘broadening formation’ or ‘loudspeaker’, which could eventually have bearish connotations if the exchange rate rises to touch the upper borderline of the pattern and is rejected.
At that point, a decline back down to the base of the broadening formation in the 1.70s may even be possible.
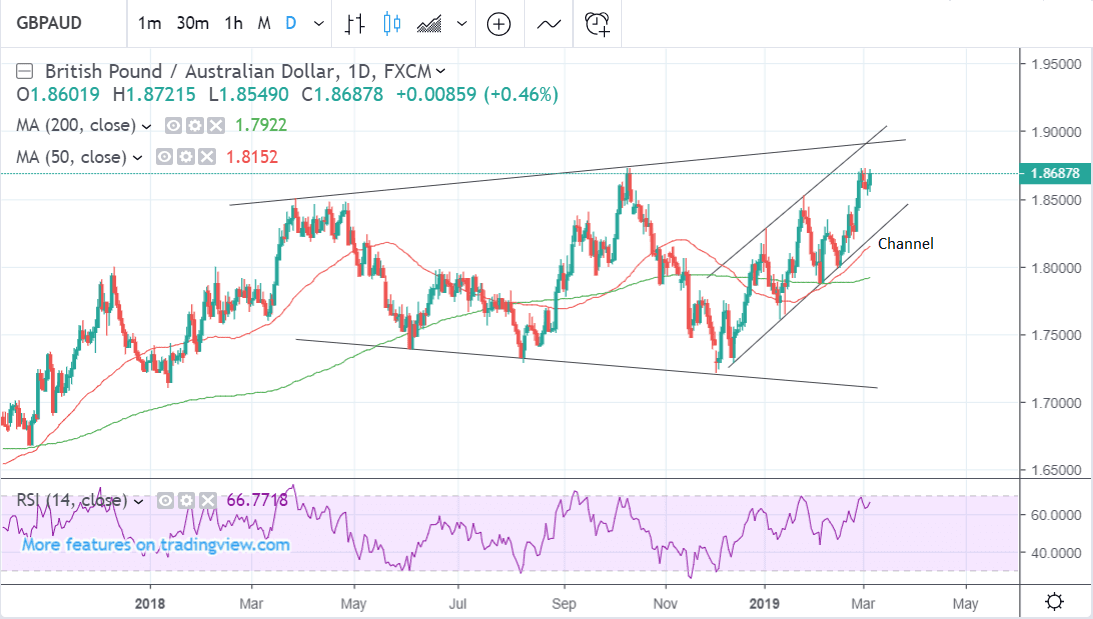
Within the broadening formation, the exchange rate has risen in an ascending channel which continues to define the uptrend.
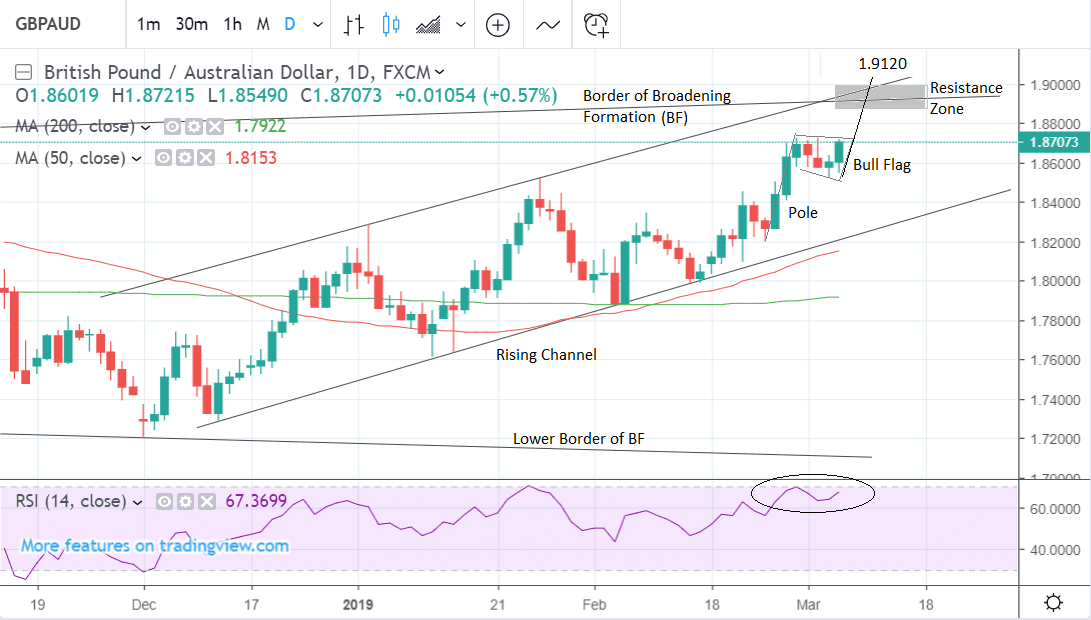
A close up of the rising channel shows how the pair is in the process of forming another pattern suggestive of more upside, called a bull flag. This consists of a steep rally during the ‘pole’ phase, followed by a pull-back in during the ‘flag’ phase.
The usual expectation is that when the flag has completed the pair will breakout higher and continue its uptrend, reaching as far as the extrapolation of the pole to the upside.
A clear break above the flag highs at 1.8725 would probably give the green-light to an extension of the flag, to an end target at 1.9120.
Yet this is only an ‘ideal’ target and not necessarily realistic or achievable. On GBP/AUD there is a thick zone of resistance at the 1.89-90 level which could obstruct further gains, made up of the top of the broadening formation and the channel. This is coloured-in in grey on the chart above.
Ultimately, this resistance zone suggests rallies may be capped at 1.8900.
The RSI momentum indicator in the lower pane is flirting with overbought levels and this is also indicative of limited gains, since it suggests many buyers have already bought into the bullish trade, making it more vulnerable to a sell-off.
Time to move your money? Get 3-5% more currency than your bank would offer by using the services of foreign exchange specialists at RationalFX. A specialist broker can deliver you an exchange rate closer to the real market rate, thereby saving you substantial quantities of currency. Find out more here.
* Advertisement


