
Why is the News Zealand Dollar So Strong? ANZ Bank’s Economists Shed Some Light
- Written by: Albert Townsend
- NZD remains a top performer in G10
- 'Carry trade' supporting NZD
- Supported by broad suite of economic fundamentals
- Technicals warn of further GBP/NZD downside

Image © Adobe Stock
- GBP/NZD reference rates at publication:
Spot: 1.9190 - High street bank rates (indicative band): 1.8518-1.8653
- Payment specialist rates (indicative band): 1.9017-1.9094
- Find out about specialist rates, here
- Or, set up an exchange rate alert, here
The Pound-to-New Zealand Dollar rate is experiencing its third week of declines as the pair pushes down into the 1.91s - but what is driving the Kiwi’s strength against Sterling, and is it likely to continue?
To help us answer these questions we look to recent research from Kiwi lender ANZ Bank and interpretations of the charts using technical analysis.
Inflation isn’t always bad
According to ANZ, the main factor driving Kiwi strength has been the higher inflation experienced by the country compared to its peers. The surprise increase in inflation in Q3, for example - which rose 4.9% - was a major driver of the New Zealand Dollar’s rise.
Inflation is usually a negative influence on a currency as it reduces its purchasing power, however, in the case where a country’s central bank has ‘inflation credibility’ such as New Zealand, the opposite is true.
This is because central banks with so-called inflation credibility are expected to have inflation under control using tools such as targeting and forward guidance.
In cases such as these, the currency actually benefits from rising inflation because it pushes up borrowing costs, and this enables currency traders to profit from what is called the ‘carry trade’.
The carry trade is when traders borrow in a currency with lower borrowing costs to buy a currency with higher interest rates.
They then effectively profit from the difference in the cost of borrowing with the interest they get from the currency they are holding, all other things being equal.
The effect of the carry trade is to increase demand for currencies where inflation rates are higher, thus elevating the exchange rate.
The higher relative inflation in New Zealand is therefore a positive for the NZD. Indeed, it is so to such an extent that it trumps all other factors - including concerns over the resurgence of the covid pandemic due to the spread of the Delta variant.
“While the downside risks surrounding COVID have not gone away (if anything, they’ve grown) our sense is that these risks have been trumped by upside risks surrounding inflation.” Says Sharon Zollner, Chief Economist at ANZ.
{wbamp-hide start}

{wbamp-hide end}{wbamp-show start}{wbamp-show end}
New Zealand’s central bank, The Reserve Bank of New Zealand (RBNZ) is also now considered relatively hawkish when compared to other central banks, having already hiked its base lending rate or OCR and having signalled that it is likely to continue to hike it. This will further drive up interest rates in NZ, increase demand for the carry trade, and drive up demand for NZD.
“As long as the RBNZ remains at the “front of the pack” in the race to raise interest rates and normalise policy, we expect the NZD to be on firmer ground than its peers - especially against currencies like JPY and EUR, where bond yields remain very low (or are still negative).” Says ANZ Bank.
This is especially true against currencies where interest rates remain very low such as JPY and EUR.
Economic data is also expected to ramp up expectations for a higher OCR rate, with Labour Market data out next week, expected to show a fall in the unemployment rate to 3.8% from 4.0% previously.
How NZD compares using ANZ’s Macroeconomic and Financial Scorecard
Inflation is not the only factor that may help the Kiwi, NZ’s macroeconomic data and country financials are also supportive (and feed into higher inflation), scoring relatively well compared to other major countries.
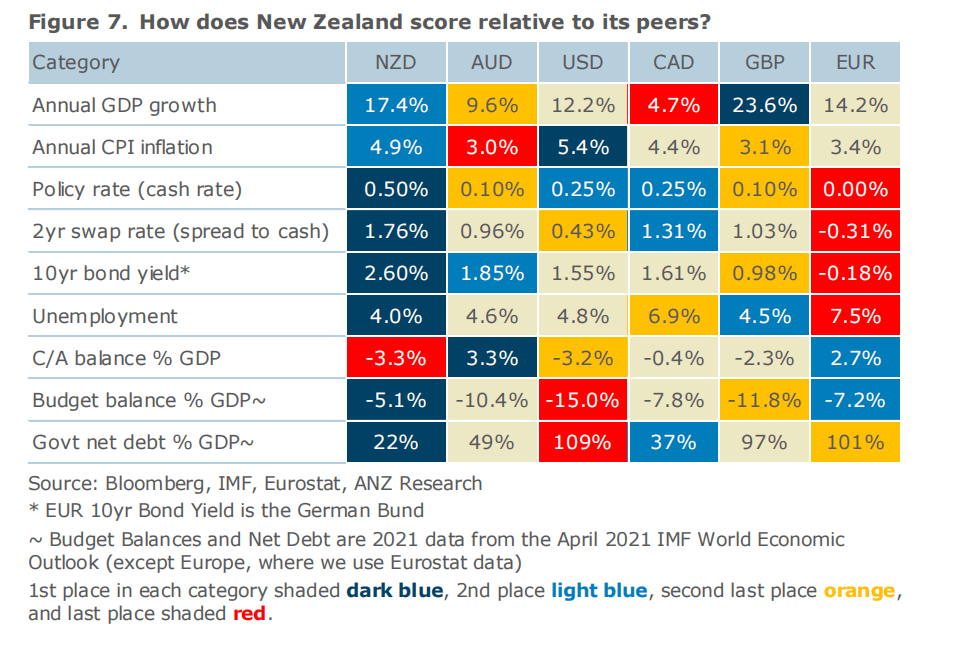
The country’s GDP growth rate is high at 17.4% and second only to the UK where growth is 23.6%, (partly because it is recovering from such a deep covid and Brexit induced slowdown).
Unemployment in NZ is lowest of all at 4.0% with the UK in second place at 4.5%.
Another metric where NZ scores well is in government debt where it has an extremely low level of debt at only 22% of GDP compared to the next highest, Canada, at 37%, and the US, which has the highest level of debt of the countries compared, at 109%.
Secure a retail exchange rate that is between 3-5% stronger than offered by leading banks, learn more.
Future Forecast
The stronger-NZD analysis from ANZ Bank falls in line with our weekly currency forecast for GBP/NZD, based on technical analysis.
In this, we forecast a continuation of the downtrend, with a break below last week’s 1.9157 lows unlocking more selling to a possible target at the level of the major trendline at roughly 1.8950.”
This is shown in the daily chart of the pair below. The chart also shows the ABC pattern forming where the first move (A) and third move (C) are expected to be of equal length or a fibonacci ratio or extension thereof.
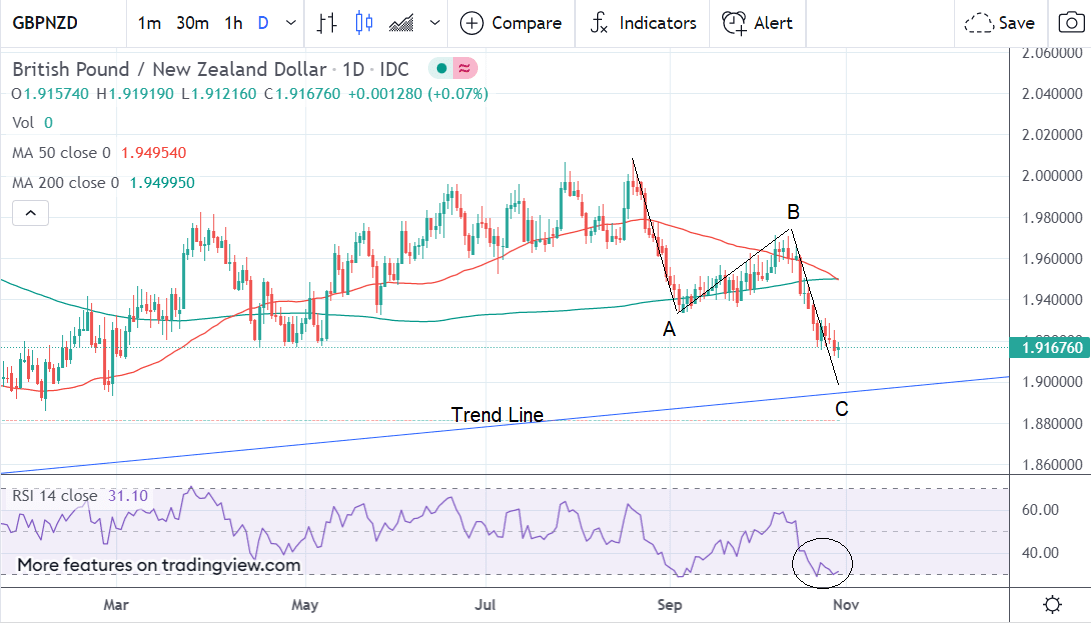
The chart seems to further reinforce a downside target near the major trendline at around 1.8950.
The chart does also contain a cautionary note for bears in the oversold RSI indicator (circled) in the bottom pane, which may indicate the market is short-term oversold, and, therefore, due a bounce.


