
GBP/EUR Rate 5-Day Forecast: Time For A Relief Rebound
- Written by: Gary Howes
- GBPEUR approaching major support
- Recent history suggests rebound potential building
- Particularly as GBPEUR decline has overshot yield spreads
- German and Eurozone inflation data in focus
- UK GDP revision watched on Friday

Image © Adobe Images
The British Pound has lost value against all its G10 peers over the past month with losses accelerating in the previous week, but our five-day forecast suggests some of those losses can be unwound.
For sure, this is by no means a bullish call as the 2023 uptrend in Pound Sterling appears to have ended alongside the Bank of England's interest rate hiking cycle, but short-term tactical bounces can begin to take shape, particularly against the Euro.
The recent selloff in the Pound to Euro exchange rate means the pair is now approaching oversold levels, as denoted by the Relative Strength Index (RSI), shown in the lower panel of the chart below.
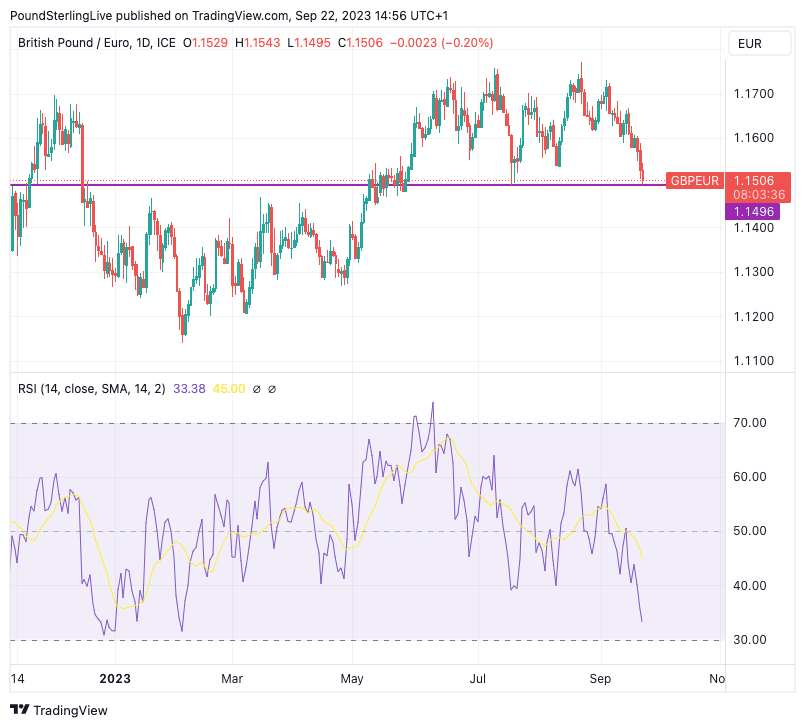
A reading of 30 or below would mean the pair is oversold and at 33.8 there is further to go. But note how levels of 33 are very rare for a pair that has tended to trend sideways through the summer months.
Also note that the line of support (purple) denotes the lower bound of the summer range, which suggests support for GBP/EUR (resistance in EUR/GBP) is at hand.
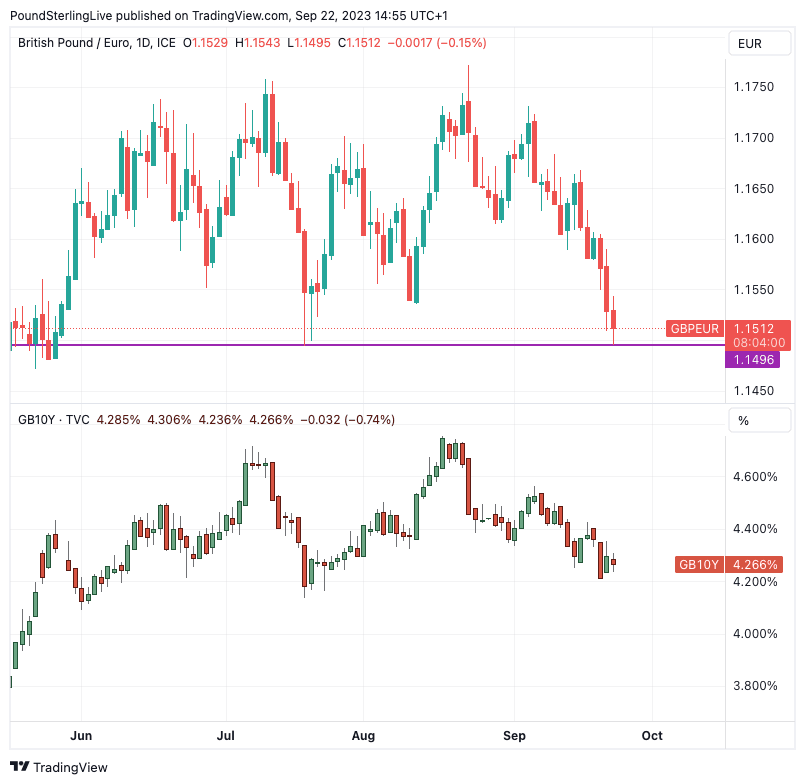
The below chart shows the Pound-Euro has been tracking the gap - or the spread - between the Germany 10-year bond yield and that of its UK equivalent:
Compare Currency Exchange Rates
Find out how much you could save on your international transfer
Estimated saving compared to high street banks:
£2,500.00
Free • No obligation • Takes 2 minutes
The lower chart shows that the gap has been closing, primarily because UK bond yields have fallen rapidly in the wake of the soft UK inflation figures and the Bank of England's decision to pause the interest rate hiking cycle.
Can that gap continue to close? If the answer is yes (the result of investors betting on more Bank of England rate cuts in 2024), then Pound-Euro can continue moving lower.
But note, the fall in the exchange rate appears to have overshot the fall in the yield spread as of late last week.
This, and the approach of that aforementioned support line, firms a view that a near-term rebound could shape up over the next five days.
The next chart shows the presence of the 200-day moving average which is a much-watched indicator by technical analysts. Curiously, the line is close to the purple support line, which offers further suspicion that traders will be lining this area with orders that can support the exchange rate.
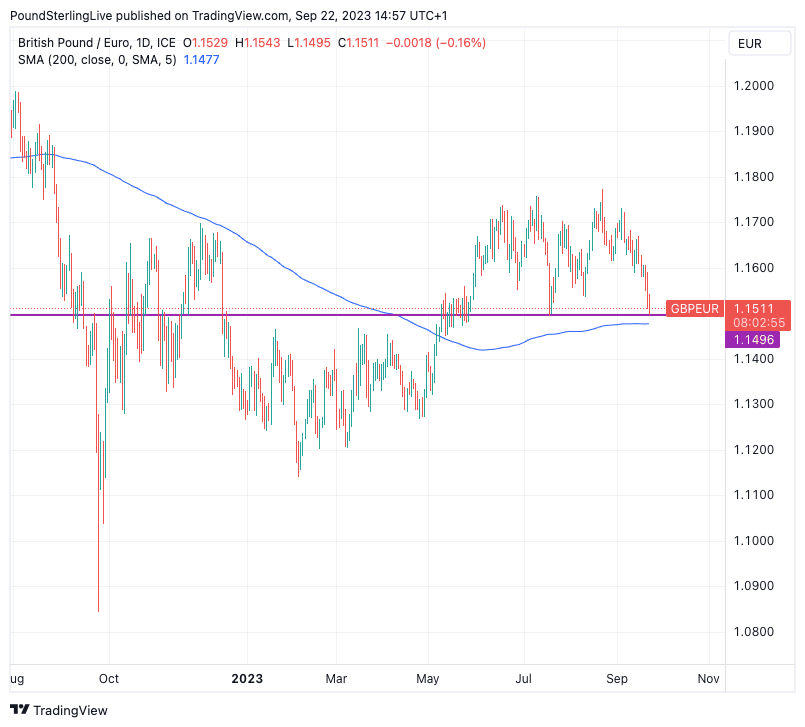
Beware, however, that a breach of support can open a trap door and quicker moves to lower levels then become a possibility.
Turning to the data calendar, we face a quiet week in the UK but Eurozone inflation due Friday will be of great interest in light of the European Central Bank's September decision to halt its rate hiking cycle.
Headline CPI inflation is forecast at 4.6% y/y, down from 5.2% previously. Core is forecast at 4.9% y/y, down from 5.3%.
"Base effects are likely to have played a role. For energy prices, we expect an increase on a monthly basis as the price of oil products surge, while the yoy rate will probably decline, shaving 0.2pp off headline inflation," says a note from UniCredit Bank.
"The ongoing slowdown in food inflation might have a similar impact. The expected decline in core inflation would reflect easing underlying pressure and a large base effect on transportation costs in Germany," it adds.
Note, though, that German inflation is due the day before and recent history has told us that this can have a greater impact on the markets given it tends to set the tone for the Friday release. Indeed, recent months have seen the market moves spent prior to the Friday release.
And to complicate matters, the German figure is often front-run by the release of state data which dribbles in through the day:

In the UK, Friday sees the second release of Q2 UK GDP data, meaning the likely market impact of the numbers will be minimal.
Markets are nevertheless looking for GDP growth in Q2 to be at 0.4% year-on-year and 0.2% quarter-on-quarter. Any major deviations could offer some short-term volatility.
Note that revisions will also be made to previous data for 2022 and 2023. This is "particularly pertinent now that the ONS has indicated huge revisions to data for 2020 and 2021 that have altered history quite considerably," says Philip Shaw, an economist at Investec.
The ONS has updated its measure of UK GDP by incorporating a wider range of improvements to sources and methods to measure output. It says the new methods put it at the forefront of global efforts to improve accuracy in measuring national accounts.
These improvements will now come forward into the official data. When the results of the updated model were announced it was revealed current price GDP growth for the UK in 2021 was revised up 0.9 percentage points to an 8.5% increase; this follows an unrevised fall of 5.8% in 2020.
Annual volume GDP growth in 2021 was revised up 1.1 percentage points to an 8.7% increase; this follows an upwardly revised 10.4% fall in 2020 (previously an 11% fall).
This means the UK is no longer the laggard amongst major peers in the post-Covid era.
Compare Currency Exchange Rates
Find out how much you could save on your international transfer
Estimated saving compared to high street banks:
£2,500.00
Free • No obligation • Takes 2 minutes


