US Dollar to Yen Showing Definite Bullish Potential

The USD/JPY has been rising sharply since a run of positive data and remarks from Federal reserve officials all but sealed the chances of the Fed increasing interest rates at their March 15 meeting.
Higher interest rates are supportive of a currency as they attract more foreign capital seeking to take advantage of the higher interest rates offered.
Now the pair has produced a strong technical signal the uptrend is going to extend even further.

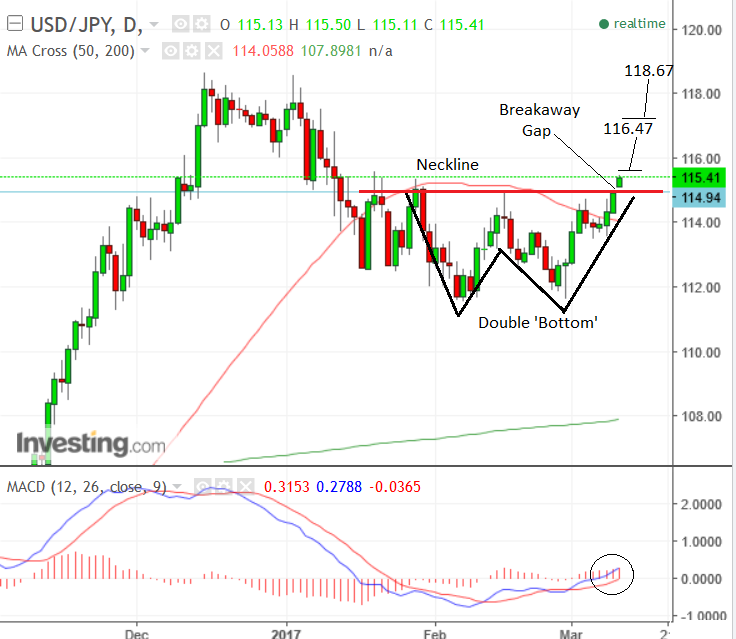
Ahead of key payrolls data from the US on Friday, USD/JPY has formed a breakaway gap just above the neckline.
Breakaway gaps are the most potent gaps in terms of forecasting potential.
They occur when a price pattern has formed and then prices suddenly gap out of the boundaries of the pattern and begin a trending move in the direction of the new trend.
This appears to be what has happened on USD/JPY after the pair formed a double bottom price pattern and then gapped above the neckline.
The neckline is the level of the intervening peak of a double bottom.
From here the pair is forecast to rise the distance of the height of the pattern extrapolated up from the neckline.
Nevertheless, an initial target presents itself at 116.47 where a monthly pivot is situated.
There are other technical signs which suggest the pair will probably rise up the whole way to a target at the previous 118.67 highs.
Commerzbank Note Break Above Ichimoku Could and Other Key Resistance
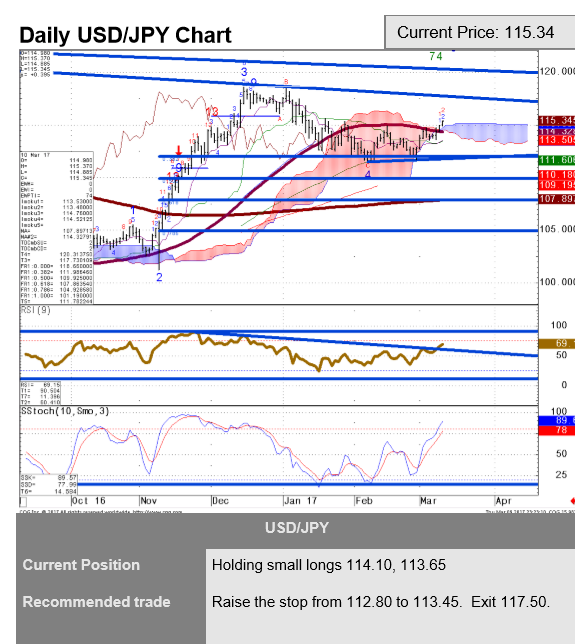
Having broken above the neckline of a double bottom on our charts with a breakaway gap we note how Commerzbank’s leading technical analysts, Karen Jones comments on some key breakthrough’s for bulls to the upside.
One such breakthrough is a move above the Ichomoku cloud, a type of analysis zone which looks like a ‘cloud’ and was painstakingly developed by a Japanese newspaper journalist in the 1960’s and 70’s.
A break above the top of the cloud as is the case in USD/JPY is a strong bullish signal, indicating a change of trend.
“The market is above the 55-day ma at 114.36 and the top of the cloud at 114.54 and has eroded the 15th February high at 114.95. This was tough resistance and we regard a close above here as an upside trigger. This introduces scope to the key short term resistance offered by the 16 month resistance line at 117.73 – and this remains our favoured view,” said Jones.

Elliot Wave Analysis
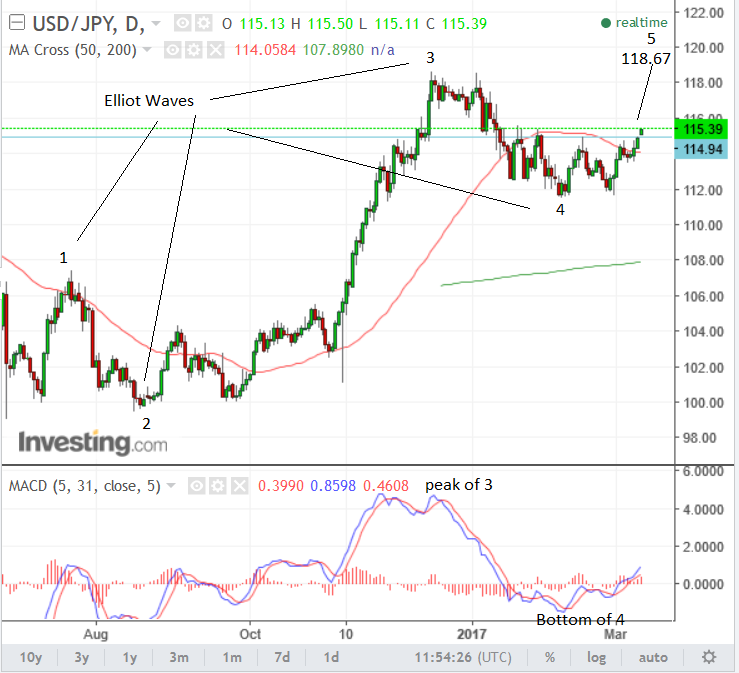
The USD/JPY chart suggests even more bullishness if analysed through the lens of a form of cycle analysis called Elliot Wave theory.
Elliot waves are five wave trending patterns and USD/JPY appears to be forming a final Elliot 5th wave higher to complete the pattern which began at the Summer 2016 lows.
The fifth wave should, according to the theory, reach at least as high as the wave three highs of 118.67.
The call is further supported by the MACD indicator which is often used by Elliot analysts to corroborate their analysis.
The MACD helps identify waves, for example, it always moves to a peak in line with the peak reached in price by the 3rd wave, which is always the strongest and steepest wave.
MACD can then identify the fourth wave because it always falls back below the zero-line when the 4th wave is forming.
This mirrors what has happened on USD/JPY so far.
Finally, the MACD always rises back above the zero-line to form a peak along with wave 5 of the price – but crucially the peak must be lower than the peak of wave 3 to identify a proper wave 5.Currently MACD is rising above the zero-line and looks to be in the process of moving up to form a lesser high in line with expectations for the formation wave 5.
Currently, MACD is rising above the zero-line and looks to be in the process of moving up to form a lesser high in line with expectations for the formation wave 5.
Wave 5 in price is almost always at least as high as 3 if not higher – very rarely lower.


