
GBP/USD: Back to the 1700's?

Image © Adobe Images
Following a significant decline in the Pound to Dollar exchange rate on Monday, investors are questioning where the selloff can end. Bilal Hafeez at Macro Hive consults the ultimate GBP/USD chart for clues.
UK financial markets have been in turmoil since the UK Prime Minister Liz Truss’ mini-Budget.
Interest rates have surged, and the pound has plunged.
The pound has now fallen 8% this month, on a nominal basis, GBP/USD has fallen to its lowest level since 1985.
But could it go lower?
When looking at currencies over longer time periods, we need to make adjustments for inflation, so we look at so-called real exchange rates.
On that basis, we find that GBP/USD is close to the post-war lows seen in 1951 and 1985:
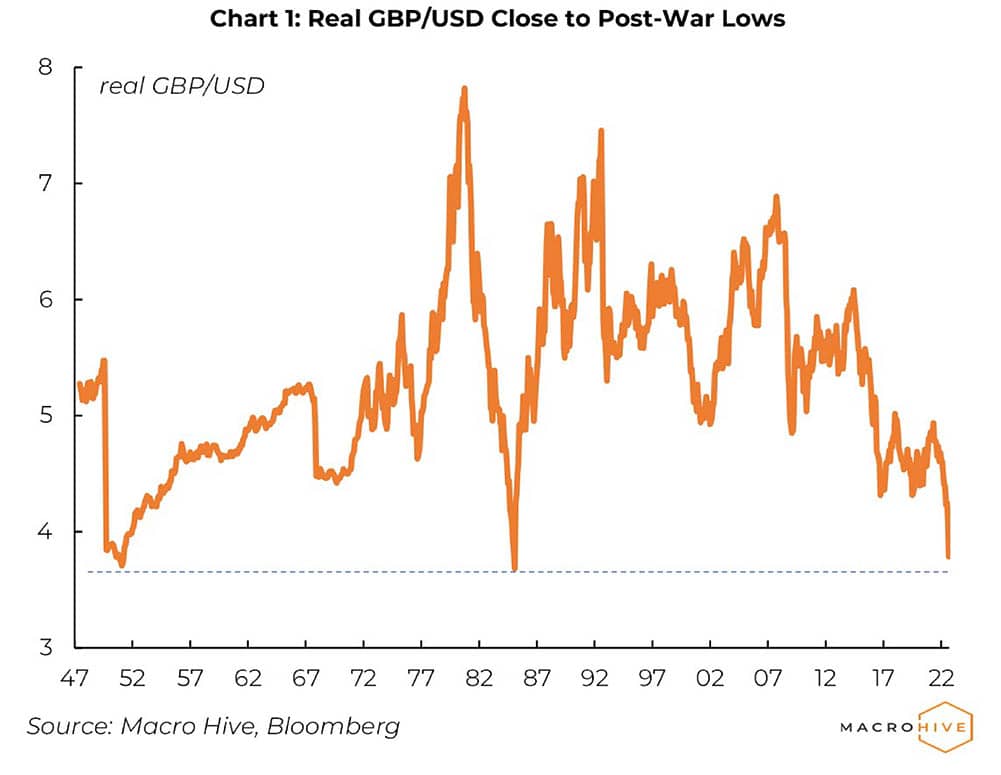
This would suggest that the pound has already weakened a lot and so the downside could be more limited.
But what if we go further back? We have data going back to the late 1700s. That was the era of ‘mad’ King George III – the one who lost America.
We find that from the late 1700s and early 1800s saw GBP/USD around 20% lower than today (in real terms):

What caused this?
It seems that expensive wars with the Americans and French didn’t help, nor did the rise of the American economy.
So, it is unclear how close that period is to today.
We'd therefore be cautious in expecting the pound to return to values last seen in the 1700s.
GBP to USD Transfer Savings Calculator
How much are you sending from pounds to dollars?
Your potential USD savings on this GBP transfer:
$1,702
By using specialist providers vs high street banks


