
GBP/USD Outlook: Cloud Resistance is First Key Hurdle
- Written by: Karen Jones, the Society of Technical Analysts

Image © Adobe Images
It's been a bit of a roller coaster for Sterling over the past few weeks.
The turmoil of charting a new all-time low at 1.0356, has been accompanied by a valiant rally higher.
So, what now for the pound? Has it done enough to reverse the damage inflicted by those tax cuts or is there more pain for the pound?
In order to answer that question, we take a look at the daily chart – so far the market has seen a correction and a correction only.
So where is the key resistance for this market and how far does it have to climb before it can reverse the damage wrought by Truss and her team?
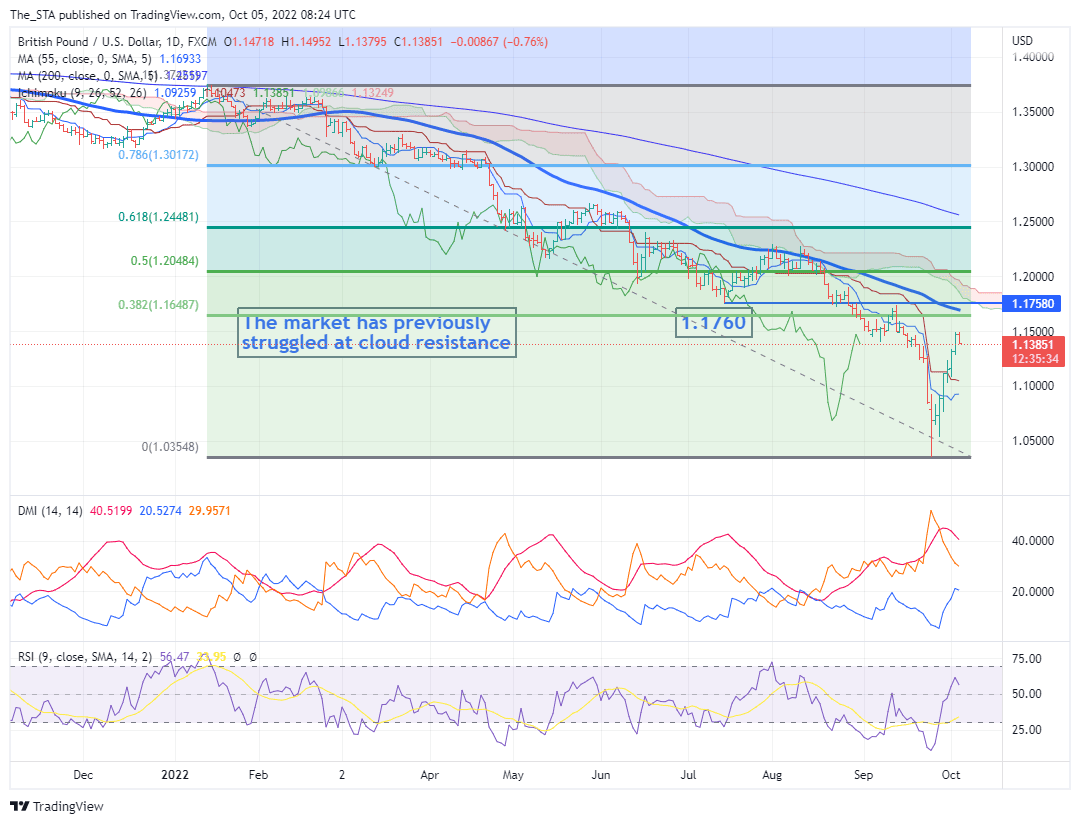
We can see a clear convergence of resistance in the 1.1650-1.1760 band, which represents the low that we got in July, the 55-day ma, the 38.2% retracement of the entire move down that we have seen this year.
All of this offers a solid band of resistance, and the market is likely to struggle to climb over this hurdle, but we suspect before it can make any real impact on those resistance levels it’s going to
need to overcome the cloud resistance.
Why is this so important?
Because not only can we see that it has acted as strong resistance since March 2022, but the market again failed at the top of this cloud in August (at 1.2277) and we suspect that this is acting as the barometer of the trend.
GBP to USD Transfer Savings Calculator
How much are you sending from pounds to dollars?
Your potential USD savings on this GBP transfer:
$1,702
By using specialist providers vs high street banks
So, in order to reverse some of the damage seen recently the market is going to have to close above this resistance as well and this is currently found at 1.1850.
We suspect that the market will see initial failure at 1.1650-1.1850 band and we are alert to the idea of failure here.
If you would like to learn more about technical analysis, the next course run by the Society of Technical Analysts starts October 12th and details about this course and the STA can be found here.
It is a pretty dense band of resistance and we suspect that the correction higher will struggle here and we are alert to the idea of initial failure.
Watch: Key resistance levels for GBP/USD
Disclaimer:
The information posted on Trading View is for informative purposes and is not intended to constitute advice in any form, including but not limited to investment, accounting, tax, legal or regulatory advice. The information therefore has no regard to the specific investment objectives, financial situation or particular needs of any specific recipient. Opinions expressed are our current opinions as of the date appearing on Trading View only. All illustrations, forecasts or hypothetical data are for illustrative purposes only. The Society of Technical Analysts Ltd does not make a representation that the information provided is appropriate for use in all jurisdictions or by all Investors or other potential Investors. Parties are therefore responsible for compliance with applicable local laws and regulations. The Society of Technical Analysts will not be held liable for any loss or damage resulting directly or indirectly from the use of any information on this site.


