Crude Oil Pushes Higher On Inventory Drawdown but Patience Required for a Real Breakout

Oil prices are up after inventories slumped last week, however, traders expecting a breakout will need to wait for further bullish confirmation.
Oil rose sharply Wednesday after U.S. Energy Information Administration (EIA) inventory data showed a dramatic fall in crude oil stockpiles last week.
The data is thought to provide the greatest insight into US supply and demand for oil in the United States and so it has a major impact on prices.
Crude oil inventories fell by 6.5 million barrels in the week ending December 15, a much higher fall than the consensus estimate for a 3.8 million drawdown, while also being higher than the previous week’s drawdown of 5.11 million barrels.
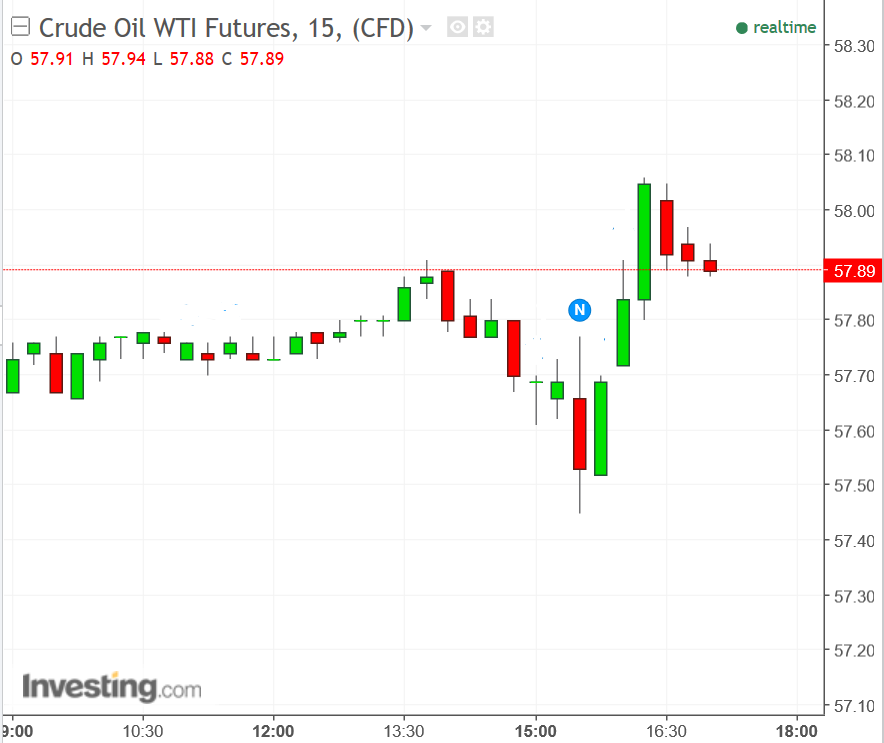
West Texas Crude Oil rose to 57.91 at the time of writing, a rise of about 30 cents from the pre-release level of 57.60.

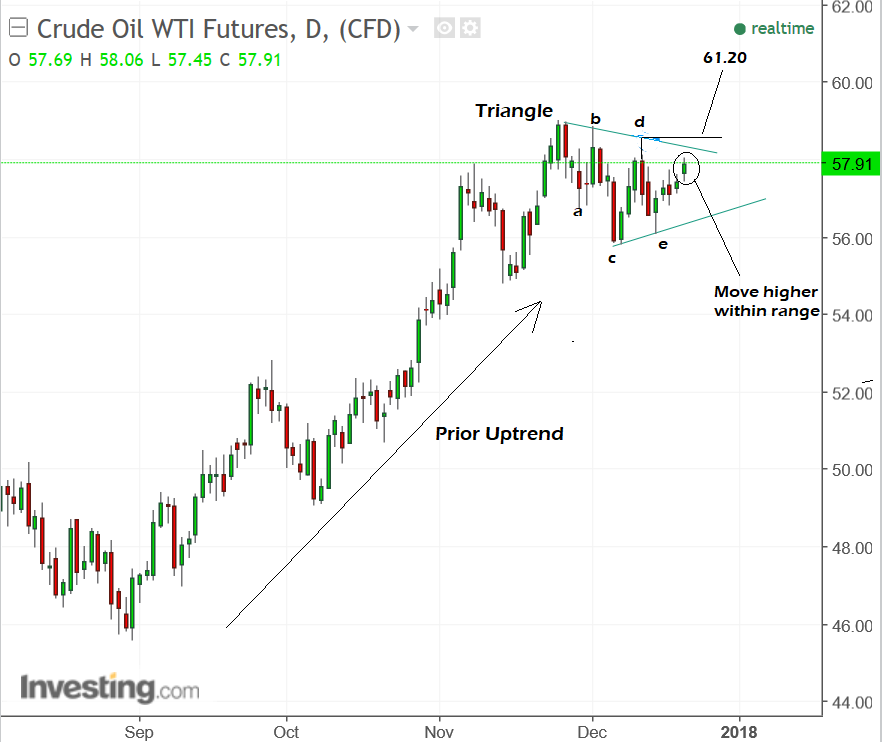
From a technical perspective, the release provided a push higher but wasn't enough for the price to breakout of the sideways range it has been oscillating within since the start of December.
The range looks much like a symmetrical triangle, which is a type of price pattern composed of tapering oscillating price waves, which eventually breakout higher or lower.

Although the pattern itself is neutral in that it gives no indication of the direction a break will eventually take, there is a marginal bias for prices to continue in the direction of the trend prior to the pattern's formation.
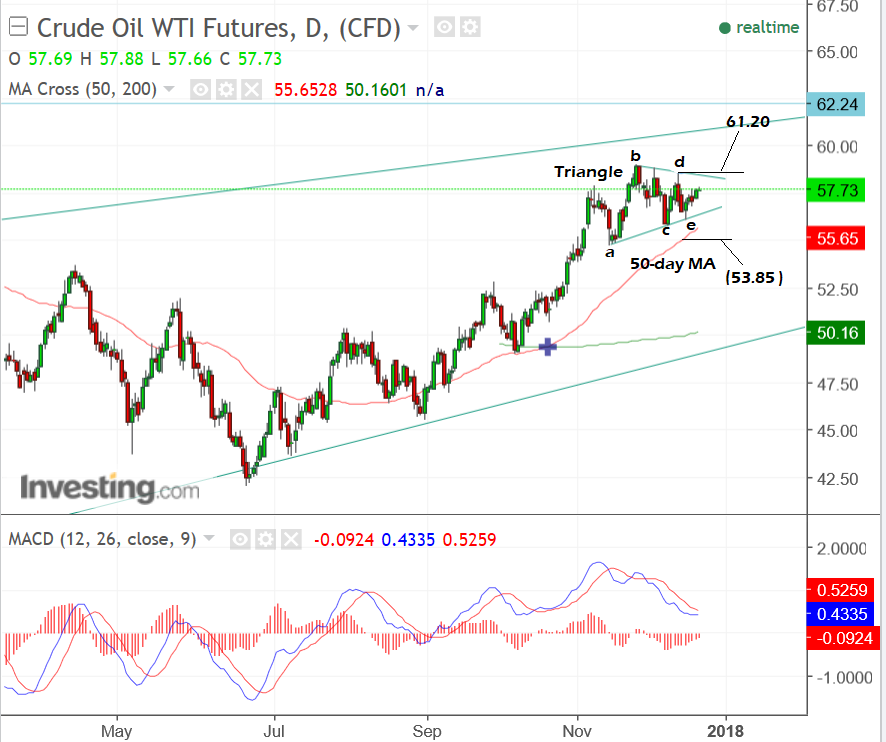
In this case the trend was up yet for a real breakout higher, we would ideally like to see a move above the 'd' wave highs at 58.56, for confirmation.
From there we would expect a follow-through of about the same distance as the height of the triangle extrapolated out from the break by about 61.8%.
This gives a target of roughly 61.20, which is fortified by the line from the rising channel bracketing the trend since its inception at the start of 2016.

Fundamental Cross-Currents
Oil prices have been supported recently by the shutdown of the Forties pipeline in the North Sea, which has threatened supplies.
However, U.S. government forecasts published on Monday suggesting that shale production will rise to record levels in January has provided some offset to this.
US shale production is becoming a major influence on global pricing and could be the reason why crude benchmarks are struggling to push higher in the face of the recent OPEC agreement to restrain production growth in order to "stabilise the market".
The Organisation of Petroleum Exporting Countries (OPEC), as well as some notable non-members such as Russia, agreed last week to continue current oil output cuts for a further nine months until the end of 2018.
The deal is an extension of an existing arrangement to cut oil output by 1.8 million barrels per day that was adopted last winter and due to end in March 2018, having already been extended once.
Impact on FX
Once a major driver of so-called petro-currencies (currencies of major crude exporters) like CAD, RUB and NOK, oil has lost much of its influence on foreign exchange rates of late.
The chart below shows how the correlation between oil prices and CAD/USD and NOK/USD decoupled in September when crude shot higher and left the other two behind.
One reason posited for the dislocation is due to the US Dollar, which has itself become more correlated to oil due to its dominance in shale production.
Another possible reason is that oil prices have been dictated more by supply-side management and OPEC dictats than they have pure economic forces of late.
Markets may be sceptical about how long this can continue for and as a result, also be sceptical about how much of an economic boost oil exporters are likely to receive from higher prices over the medium term.

Get up to 5% more foreign exchange by using a specialist provider by getting closer to the real market rate and avoid the gaping spreads charged by your bank for international payments. Learn more here.


