Gold Price Outlook: Ready for Gains

© thanasak
Gold prices are primed for a cyclical rise soon according to a major investement bank, and price charts corroborate this view.
With bond markets out of favour and equities seemingly overvalued where's an investor to turn? The answer could be gold.
Or at least that is what analyst Natasha Kaneva of JP Morgan Chase appears to be saying in a recent note when she forecasts a cyclical upturn in all commodities, not just gold.
At this stage in the US business cycle commodities show a marked tendency to evaluate.
"Commodities as a broad asset class exhibit reasonably consistent late-cycle price behaviour," says the analyst.
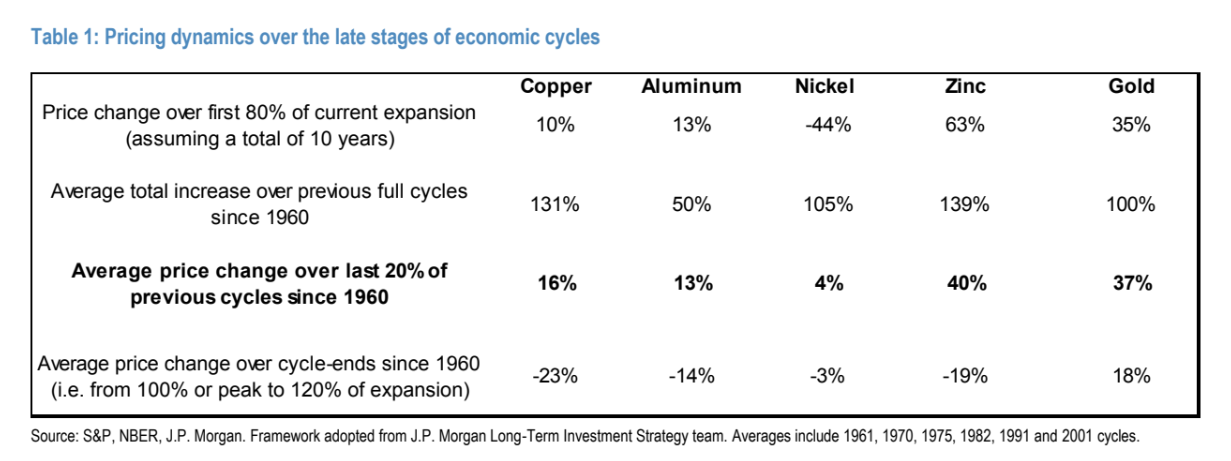
Kaneva sets out to prove her cycle hypothesis by analysing and comparing commodity late-cycle behaviour since the 1960s, and as the chart below attests, there does seem to be strong evidence of a repeating pattern.

With reference to chart above the current cycle is supposed to be 80% complete which means for commodities the greatest phase of price growth is just about to begin.
"Assuming the current cycle will stretch well into 2019, the current expansion is roughly 80% complete but just beginning of one of the strongest periods for metals prices broadly," says Kaneva.
And for Gold, specifically, there appears to a be a lot of upside still to come.
"History shows gold prices have also rallied almost 40% on average over the last two years of recent expansions. This would imply a peak cycle gold price of around $1,700/oz in 2019," says the analyst.
Indeed the chart and table below, which shows where the price is in the commodity cycle, suggests gold is about to embark on its strongest uptrend ever.


Not all analysts are bullish about gold, UBS's Toni Traves sees the metal going sideways.
He notes how the recent payrolls data which pushed up bond yields was an anathema to Gold.
"Gold has been taking most of its cues from external forces. Developments in the US remain the key influence. Strong payroll numbers on Friday and higher yields pushed gold lower," says Traves.
Yet this is not the normal relationship dynamic between gold and yields: usually higher yields equal higher gold prices.
Yields reflect inflation expectations as they are the compensation bondholders recieve for inflation errosion, thus higher yields represent higher inflation expectations.
Gold is traditionally used as a safe-haven for investors seeking to retain value during periods of rising inflation.
"Historically, gold has been used as a hedge against inflation. During the run up in to its peak price in 1980, gold was chasing the inflation rate as investors feared that their purchasing power was going to be destroyed by runaway prices," says Financial Symmetry financial writer Will Holt.
If anything the dubious reaction of gold to the higher wage data suggests market manipulation or some other dynamic is dominating the metal's prices.
Technical Analysis Also Bullish
It's not just a fundamental analysis which says gold may be on the brink of going through a purple patch - so does gold's price charts.
One way to analyse price charts is to use a method called Elliot Wave analysis which posits that asset prices move in five wave cycles up and three wave cycles down.
An idealized representation of such a wave is shown below:

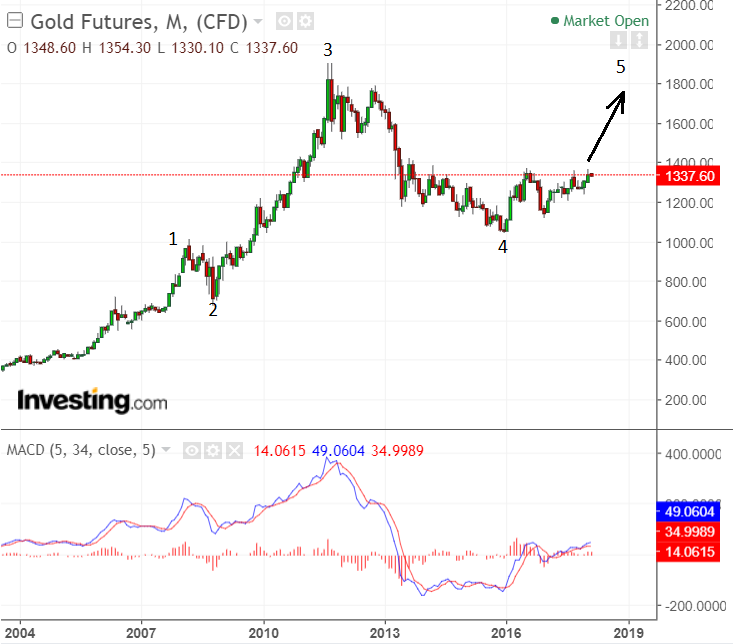
If we now look at a long-term chart of gold it is possible to see how it could be following the same five wave Elliot pattern higher.

According to my wave count the long-term chart of gold shows the metal in the midst of forming wave 4 before it rises up in the final wave 5 higher.
There is a high probability that wave 5 will reach the highs of wave 3 at $1911 peak.
A tool called an Elliot wave oscillator (EWO) can help identify wave counts and such an EWO indicator is in the lower panel of the monthly chart above, (the EWO is in fact just a MACD momentum indicator on a 5, 35, 5 setting).
The EWO always peaks with wave 3 and then falls below the zero-line to indicate wave 4 has completed.
It then rises up above the zero-line again and makes a high when wave 5 evolves, although the EWO high is never as high as the wave 3 peak even if the actual price is.
The EWO suggests gold is in a wave 4 but about to start wave 5 as it is still just below the zero-line.
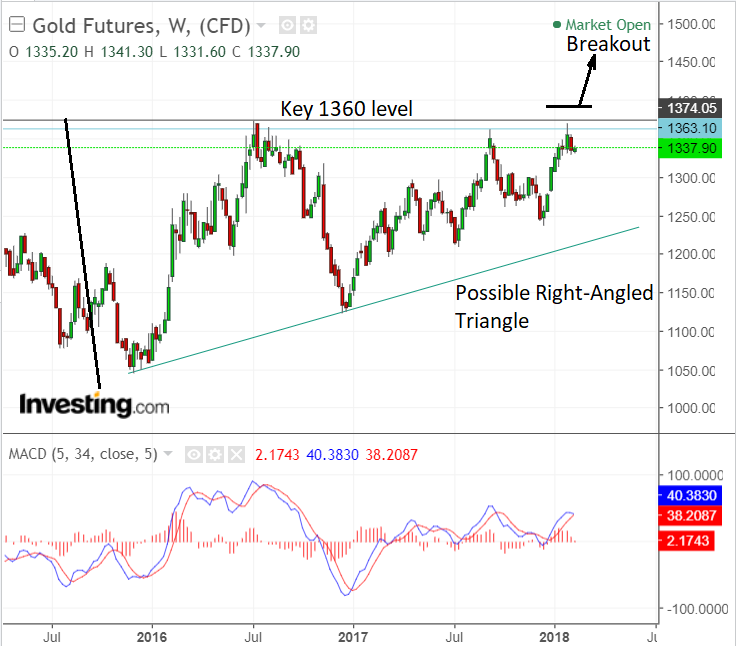
Wave 4 may in fact be forming a right-angled triangle pattern before it evolves into wave 5.
This is due to the multiple touches of the 1360 highs, and the steadily higher lows below.

Triangle's are always the last patterns in wave 4's according to the laws of Elliot, so if it is forming a triangle then must go on to form wave 5 higher when it has finished.
Even if it is not forming a triangle then the 1360 level is important and a decisive break above it would probably result in a strong breakout higher, and cause us to adopt a bullish stance on the commodity.