GBP/CHF Showing Potential For Further Declines, 1.3500 Eyed
- GBP/CHF has probably peaked and rolled over
- The pair is expected to extend its decline to the next major chart level at 1.3500
- Longer-term the trend remains bullish

© moonrise, Adobe Stock
The short-term trend has probably turned negative for GBP/CHF, and the pair is vulnerable to more loses on the horizon.
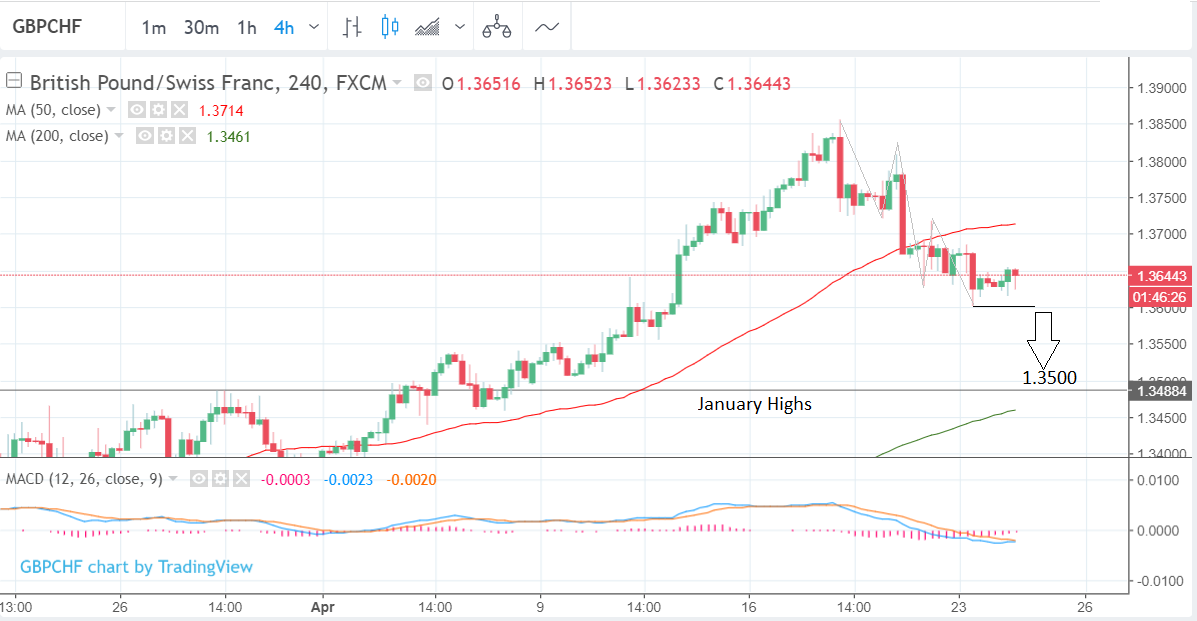
The GBP/CHF pair is in the midst of pulling- back after peaking at 1.3856, on April 18.
GBP/CHF has been in a long-term uptrend ever since the establishment of the March lows but recently it rolled over after peaking and starting losing ground.
The exchange rate has now fallen to a current spot rate of 1.3645, and we think it is poised for further declines as the short-term trend extends lower.
Although the current bout of weakness looks merely corrective on the daily chart (see above), the four-hour chart below shows a clear progression of peaks and troughs lower, suggesting the new short-term trend has probably turned bearish and is expected to extend in that direction.
We expect a break below the 1.3601 lows to lead to a continuation down to the next target at 1.3500 where the January highs are situated.
Major highs often represent levels on charts which become obstacles to the established trend and the January highs may well be a case in point.
The reason for this is complex but is partly due to the fact that many traders will have bought the pair when it last broke above the January highs and if they are still in those trades could now find themselves back to break-even again after being in profit. Those same traders may now be tempted to close their trades at 1.3500 in order to avoid the risk of losing money, if the exchange rate falls even lower.
There is a strong possibility, therefore, that the exchange rate may well stall or possibly even turn around and start moving higher if it trends down to 1.3500, and that is why we have established our next downside target at that level.
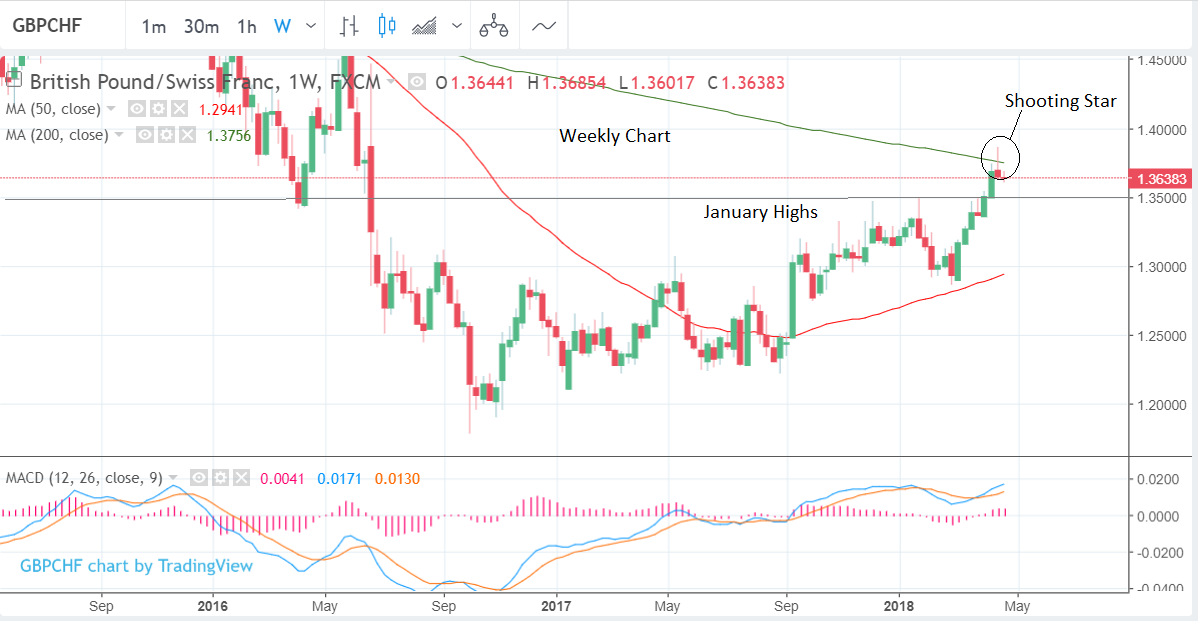
A bearish shooting star Japanese candlestick pattern on the weekly chart (see below) provides further evidence of a bias for more downside; the shooting star gains reliability as an indicator of bearishness if it is followed by a bearish confirmation candle, which is what would happen if the current week ends as a down-week.
The 200-week moving average (MA) (green line in chart above) is touching the shooting star at 1.3756 and is a further bearish indicator capping gains, as major moving averages like the 200-week often also act as obstacles to the trend, preventing upside progress and sometimes even leading to reversals.
Large moving averages are particularly difficult to overcome as they are the locations of increased supply or demand due to more trading activity because they are popular, widely employed, decision making tools amongst investors, both private and institutional alike.
Get up to 5% more foreign exchange by using a specialist provider to get closer to the real market rate and avoid the gaping spreads charged by your bank when providing currency. Learn more here.


