The New Zealand Dollar has Peaked: The Building Evidence

The New Zealand Dollar has been one of the strongest G10 currencies over recent years, but its days as top dog may be numbered warn analysts.
The currency's supremacy will be challenged as other nations see their base interest rates catch up with New Zealand’s high interest rates, which were well above those of most of its other G10 peers.
This advantage has seen massive currency flows to New Zealand from investors seeking to park their money there and watch it grow.
A fall in New Zealand interest and rise in US interest rates since then, however, has closed the gap to only 0.5% (from over 3.25% two years ago), and this has led to flows drying up and the NZD weakening.
Now, other central banks are also signalling that they are moving towards dismantling simulative policies and also raising interest rates.
This has become especially clear at the central banking forum in Sintra where the European Central Bank and Bank of England signalled a future of higher rates.
This has made investors even more reluctant to move money to New Zealand for the interest rate advantage.
Credit Suisse See a Turning Point
Analysts have started debating what the impact on the New Zealand dollar will be and the consensus appears to be that it will be negative.
Although the economy is reasonably strong and exports have held up relatively well, there is no motivation from the Reserve Bank of New Zealand (RBNZ) to raise interest rates.
Firstly, inflation is still not particularly high so they do not need to raise interest rates, and secondly the RBNZ do not want a stronger New Zealand Dollar as that will negatively impact on exports.
This the outlook continues to be negative for the Kiwi from a fundamental perspective.
Now, fresh evidence from Credit Suisse shows the rally in the New Zealand Dollar may not be sustainable, for technical reasons too.
The Kiwi’s TWI – or trade weighted index which is a measure of the currency's value based on its relationship with major trading partners – has reached a top.
According to the Credit Suisse’s Christopher Hine, the broader New Zealand Dollar is now likely to reverse trend and start falling.
Get up to 5% more foreign exchange on your NZD requirements by using a specialist provider. Get closer to the real market rate and avoid the gaping spreads charged by your bank for international payments. Learn more here.
The NZD's TWI chart has reached the Fibonacci retracement level of the previous down move and then formed a topping pattern, which together indicates the probability of a reversal to the downside.
When currencies correct back after a move down, certain retracement levels are seen as having special qualities, for example, the midpoint, or 50% retracement, the 61.8% level, and the 78.6% level are all seen as potential endpoints for the correction and reversal and resumption of the downtrend.
In the case of the New Zealand TWI the pair corrected back 78.6% of the previous down-move, rotated and is now expected to start moving back down again – indicating the NZD will weaken.
“NZD (RBNZ) TWI has seen a strong rally since its trough in May at 74.70, but it has recently found renewed selling at the 78.6% retracement of the February/March fall at 79.15, and completed a small top below 78.14. We look for weakness to extend to the 38.2% retracement of the recent rally and 200-day average at 77.47/77.42,” said Hine.
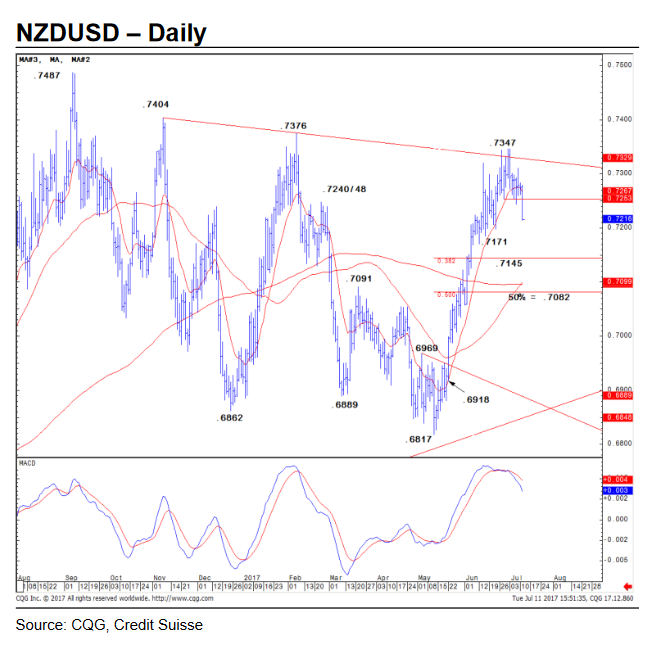
NZD/USD’s bearish chart reinforces the negative outlook for the Kiwi after it reached and then formed a top at a major trendline connecting the October 2016 and January 2017 highs.

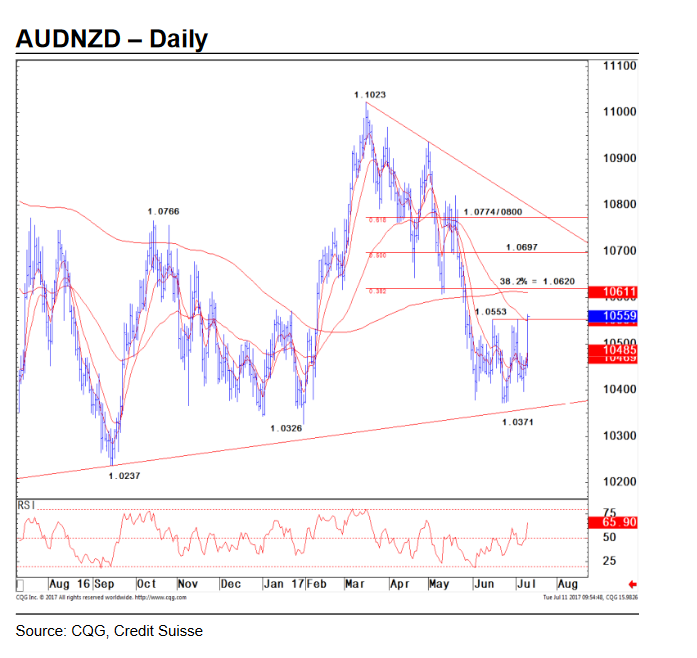
With AUD/NZD, there is likewise a bearish outlook for the Kiwi side of the pair after it formed an inverse Head and Shoulders bottoming pattern close to a trendline in the 1.03s.

These patterns are formed of three troughs, the middle one of which, or ‘head’ is the lowest, and the two either side, the ‘shoulders’.
The exchange rate has now broken above the upper boundary of the pattern, or neckline as it is known and this is a signal that the exchange rate is possibly reversing trend and moving higher.
“This confirms a reverse "head and shoulders" base and signals the start of a bull trend for the 200-day average and 38.2% retracement of the March/June fall at 1.0611/20 initially. We would expect this to cap at first, but above here can target the 50% retracement at 1.0697 next, then the measured objective from the base at 1.0734,” remarked Hines of the pair.


