Pound / New Zealand Dollar Week Ahead Forecast: Marginally Bearish Short-Term, RBNZ Meeting Highlighted
- Written by: Albert Townsend
- The trend is unclear but GBP/NZD looks weak short-term
- The daily chart looks bullish; the weekly still undecided
- The RBNZ interest rate decision main fundamental event

Image © Adobe Stock
The Pound to New Zealand Dollar rate is trading at around 1.9182 at the time of writing after rising 0.81% in the week before.
But studies of the charts suggest a choppy week ahead and there appears to be a marginally bearish tilt to the outlook.
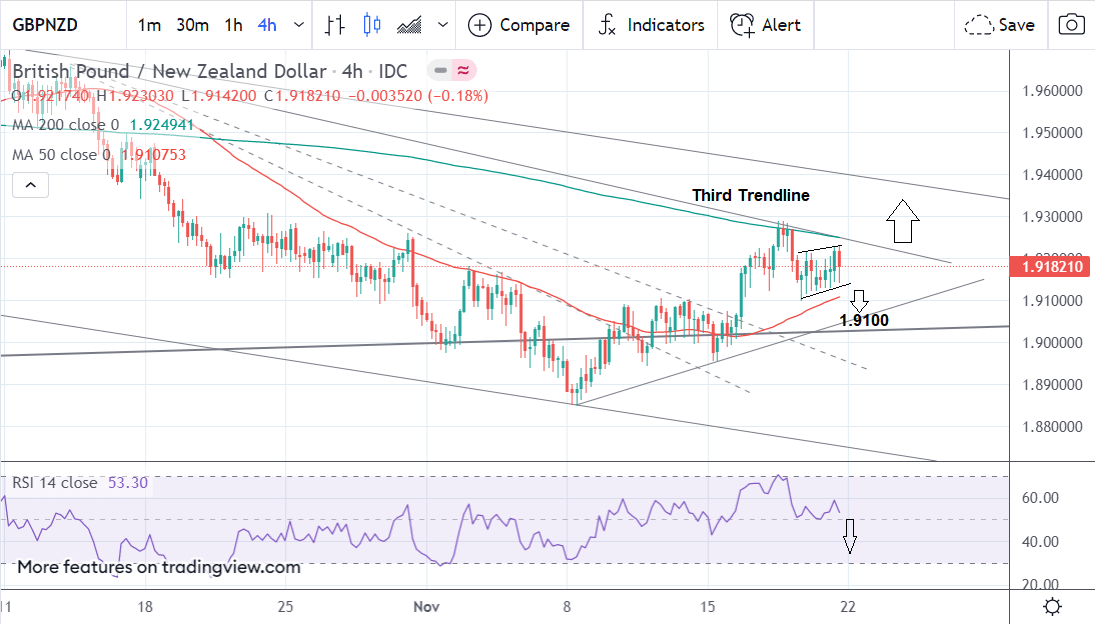
The 4 hour chart shows that after peaking on Nov. 17 the pair fell and then entered a sideways consolidation.
This looks like the middle phase of a three part move lower:
Above: GBP/NZD four-hour chart with annotations. Copyright Pound Sterling Live.
- GBP/NZD reference rates at publication:
Spot: 1.9186 - High street bank rates (indicative band): 1.8521-1.8656
- Payment specialist rates (indicative band): 1.9020-1.9097
- Find out about specialist rates, here
- Or, set up an exchange rate alert, here
The final leg down looks still to come, and may touch the 50-hr MA at 1.9107 at the very least, and possibly even the trendline in the 1.9060-70 region if bearish penetration is deeper.
The 4-hour chart is used to assess the short-term trend, that is the likely direction over the next week to five days.
The RSI indicator in the bottom pane is reinforcing the likelihood of one final thrust lower, after having fallen from its peak in the overbought zone and then flatlining in an L-shape.
The next most likely direction is another leg lower.
Despite the pressure to push down, the overall downtrend which dominated the pair throughout much of October looks in doubt.
A break and close above the third trendline redrawn for this month-long downtrend at around 1.9240 would signal a reversal of the short-term trend from bearish to bullish and further upside.
The daily chart shows the pair having bounced convincingly at the level of the major trendline.
Above: GBP/NZD four-hour chart with annotations. Copyright Pound Sterling Live.
{wbamp-hide start}
{wbamp-hide end}{wbamp-show start}{wbamp-show end}
The long green bullish candle printed on November 16 suggests a possible reversal of the short-term trend from bearish to bullish.
Although the market sold off on the 18th it did not sell off deeply and the pair continued higher on the day after. It now looks poised to continue on its way up.
The pair looks more bullish on this chart and further upside looks probable - the trendline at 1.9240, drawn from the October highs would, however, need to be breached for confirmation.
Even so, the 50-day MA lies not far above at 1.9318 and would probably cap further gains.
The weekly chart shows the conclusion of the three-wave a-b-c measured move lower. This pattern finished at the level of the major multi-month trendline and the pair has since bounced, with two green candles in a row.
Above: GBP/NZD weekly chart with annotations. Copyright Pound Sterling Live.
The weekly chart provides a long term context on the major trends impacting the exchange rate and allows us some insight into potential direction in coming weeks and months.
It is still unclear whether this is the beginning of a new longer-term uptrend or simply a short-lived bounce - only time will tell.
Yet without a firm reversal signature, the historic downtrend remains dominant and therefore partially favoured.
A clear bearish renewal signal would be required to bring fresh faith to bears. Such a sign could only come from a break back down below the trendline and the 1.8973 lows.
If such a break were to occur it would give the green light to a continuation down to a target at 1.8360, generated by extrapolating the move prior the touchdown on the trendline (wave c of the measured move) by a Fibonacci 61.8%.
The New Zealand Dollar: What to Watch this Week
The main event in the week ahead for the Kiwi dollar is the RBNZ interest rate decision at 1:00 GMT, on Wednesday, November 24.
There is growing speculation the RBNZ may increase base borrowing costs (the OCR) from the current 0.50% to 0.75% at the meeting following increasing signs of inflation, a slew of positive economic data releases and cautious relief from Covid restrictions.
Last week saw the release of Inflation Expectations for Q4 which came out at 2.97%, a rise from the 2.27% printed in Q3.
Inflation expectations measures expectations of inflation two years from now. It is calculated by the RBNZ itself and forms the basis of many of the bank’s decisions.
The higher result increases the probability of a rate hike on Wednesday as it shows long-term inflation expectations are now at the upper band of the RBNZ’s 1-3% target range.
If the central bank does decide to hike rates the move will trigger support for the Kiwi.
Higher interest rates strengthen a currency because of the carry trade where traders borrow money in a currency with low borrowing costs to purchase a currency with higher interest rates - pocketing the differential between the two rates as profit.
The other key release for the Kiwi in the week ahead are Retail Sales for Q3. These came out at 3.3% and 3.4% Ex Autos in Q2.
A higher result will further support the Kiwi as it will suggest even greater inflationary pressures, increasing the chances of a rate hike from the RBNZ.
Data released earlier in the month showed Electronic Card Retail Sales for October rose 10.1% MoM, a substantial increase from the 1.0% rise in the previous month, and this suggests overall retail sales will also show a rise.


