Chart Studies Suggest South African Rand Could see Potential Relief Ahead

South Africa's Rand fell in spectacular fashion over the course of the past week after South African President Jacob Zuma fired the country’s respected Finance minister Pravin Gordhan and replaced him with a relative unknown.
The future of the stability of the country’s economy has been brought into question by a Preseident apparently more concerned about securing his own political position than appointing the right people to the right places.
The outlook for the Rand is certainly up for debate and it's always a risk trying to forecast currencies that are being bucked by political instability and speculation.
But, when it comes to technical analysis we can be thankful that we have some set rules to follow which can give us some targets to aim for.
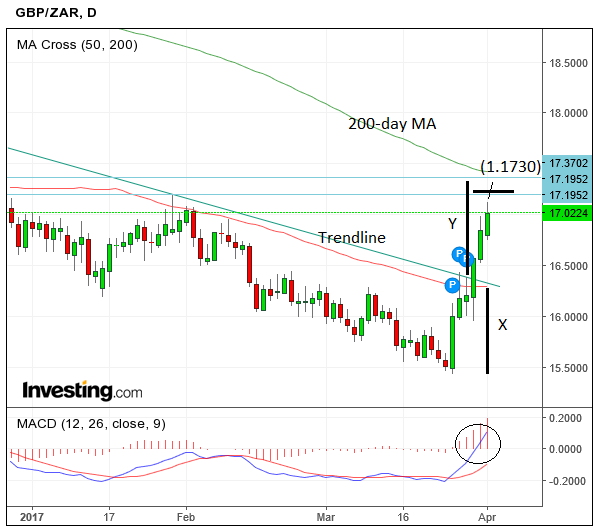
The Pound, Dollar and Euro all rose vertically versus the Rand in the days that followed, with GBP/ZAR reaching highs of 17.13 from 15.44 only six days previously.
USD/ZAR and EUR/ZAR likewise rose on the news: the former from 12.30 to 13.69 and the latter from lows of 13.37 to highs of 14.61.
GBP/ZAR is closing in on its next target, which is calculated by extrapolating the height of the move prior to the trendline break at about 16.40 (X) above the break (Y), leading to a target of 17.30.

This is also just below the level of the 200-day moving average (MA), which is expected to exert tough resistance on the chart and is often the location of reversals of the trend. At the very least the exchange rate is expected to stall or pullback at the 200-day as more bears enter the fray.
Before reaching that level, however, there is a tough resistance level at 17.19 which also needs overcoming, which is at the level of the key January highs and of the 61.8% Fibonacci retracement of the previous decline, a level which is thought to have a special significance due to its relationship with the golden mean in mathematics, and this may contain the exchange rate and push it down before it can get to 17.30.
As such we would want to see a clear move above 17.19, confirmed by a break above the 17.24 level, for confirmation of a continuation up to 17.30 – however, this is not a conviction call, given the short-term rally looks a little stretched and ripe for a consolidation or pullback.
EUR/ZAR
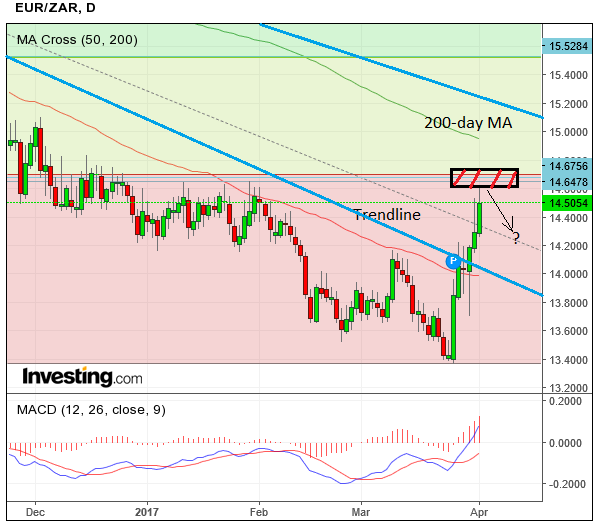
The Euro to Rand currency pair is fast approaching a tough resistance zone where it will probably stall, pull-back or reverse course.
The zone is illustrated on the chart below as a black box with red hatching.
It is composed of a resistance level which repulsed price on three occasions in January, the 200-week MA, and the 31.8% Fibonacci retracement of the previous move lower.
This is likely to prove extremely resilient to the up-trend.
The pair has probably reached the target calculated from the trendline break, by moving the roughly the same distance higher after the break as it moved in the wave prior to the break, thus conforming with technical analysis theory.
It is now likely that a pull-back may bring the exchange rate back down to the region of 14.200.
The strength of the spike higher in the last week, however, indicates the exchange rate will probably resume its young rally higher eventually, however.

USD/ZAR
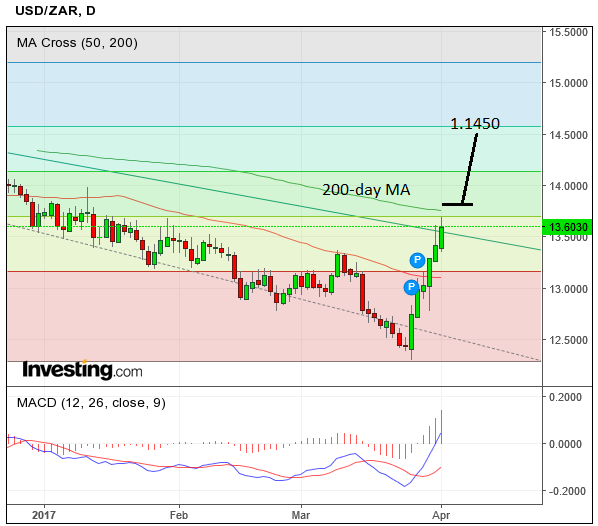
This is the most bullish chart of the three.
The exchange rate looks like it has successfully broken above a major trendline drawn from the August highs and is poised to consolidate its break and extend higher.
The 200-day moving average is not far above the trendline and the current market level, however, and is likely to inhibit further upside.
A break clearly above, however, confirmed by a move above the 13.85 would probably reach a target at 14.50, calculated by extrapolating the length of the move prior to the trendline break from the break higher.


