Swiss Franc Showing Signs of Topping Against the Dollar

The USD/CHF is showing signs of rebounding in line with most Dollar-based pairs, and following the general pattern of the Dollar's current, potential, 'renaissance'.
On August 29 the pair whipsawed down and up again, spiking right down to lows of 0.9430 before ending the day back up at 0.9555.
The sharp up-and-down 24-hour move almost certainly had something to do with the pair's sensitivity to risk as it coincided with the Korean missile test over Japan which created a geopolitical moment and led to a capital flight to safety.
It seems initially traders bought the Swiss Franc and sold the Dollar as the 'Swissie' is traditionally a first port of call for investors during risky periods, along with gold and the Yen.
The Dollar's eventual recovery at the end of the day, however, could be explained by the complementary rise in US Treasury Bonds at the time.
US Treasuries are another classic 'safe' investment in times of crisis which had fallen out of favour with investors over recent years, however, the recovery in the Dollar could be due to renewed investor demand for US T-bonds.
If investors continue to favour treasuries as a risk off play, the Dollar could once again become a safe-haven currency as it was previously, during the Eurozone debt crisis, for example, thus changing its dynamics materially.
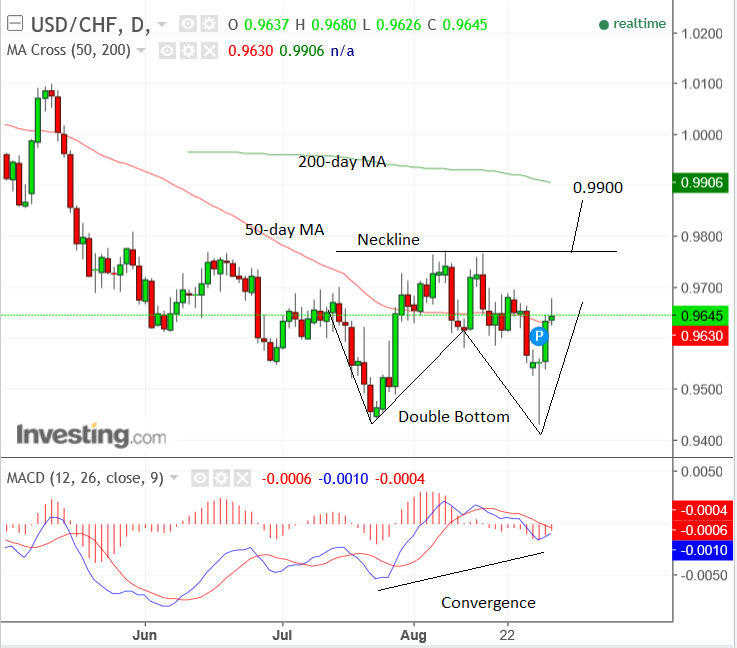
From a purely technical perspective the pair may well have formed what looks like a double bottom reversal pattern following the spike lows of the 29th.
These patterns loosely resemble the outline of the letter 'W', occur at market lows, and indicate the downtrend is about to reverse.
A break above the top of the 'W' - a level known as the neckline - is the signal for activation of the pattern's bullish 'properties'.
The break generates a target which is the height of the pattern extrapolated higher from the neckline.
In the case of USD/CHF we have estimated the neckline at 0.9772 and the target at 0.9900, which is actually slightly below that indicated by the height of the pattern, however, this is because the 200-day moving average is at 0.9905 and likely to prevent progress higher.
A further bullish indicator is the extreme convergence between MACD and price, with MACD failing to reflect the spike lower on the 29th.

An analysis of the whipsaw move of August 29 by Commerzbank's Karen Jones yields a complimentary analysis which reinforces our view that the pair may have put in an important bottom.
"USD/CHF recently briefly dropped into 2 year lows but the move was not sustained and it has seen an aggressive rebound from a support line circa 0.9423 (drawn from the November 2016 low to the July low)," said Jones, adding:
"The spike lower looks exhaustive and we suspect that it may have based for now. Near term rallies will find initial resistance at the 0.9699 August 23 high. More significant resistance can be seen at the current August highs at 0.9770/72."
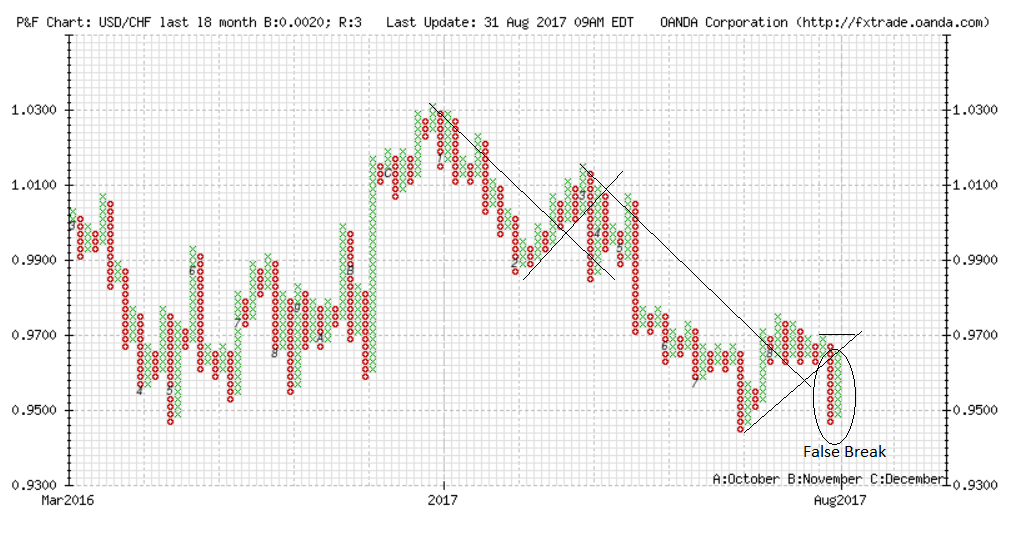
Looking at the pair through the prism of a Point and Figure Chart format yields further interesting insights.
According to classic point and figure theory, the pair's spike down did not qualify as a proper breach of the up-trendline which the pair was following higher at the time.
Instead the spike down was just a 'false break'.
This is because it did not back up and then push lower again in a second column down, which is the minimum requirement for a proper break of trendline.
As such the trend is still technically up on our point and figure chart, with a move above the top of the up column at 0.9700 reinvigorating the uptrend with a fresh double top 'buy' signal.

Fed Rate Hike Ambitions on Hold?
One interesting view put forward by Carlo Alberto De Casa, Chief Analyst at ActivTrades, is that the current geopolitical crisis has birthed a new trend higher in gold, which probably indicates a less aggressive rate-hiking strategy from the Fed going forward.
"The tensions between the USA and North Korea gave new strength to the yellow metal’s recovery," says De Casa, adding that there is a close negative correlation between gold and interest rates.
He sees the Fed as moving steadily towards a more 'on-hold' position due to geopolitical risks, which would neatly fit in with the uptrend in Gold.
"According to a recent survey by Reuters, more than 50% of operators do not believe Janet Yellen’s speeches about a new interest rate hike within the current year.
"Consequently, the entire plan set by the Federal Reserve (three more hikes in 2018 and 2019) could be in crisis. This is the broadest context in which Gold’s recovery can be placed: the inverse correlation between American rates and the precious metal is well known," said De Casa.


