USD/JPY Has Finished Correction say Commerzbank

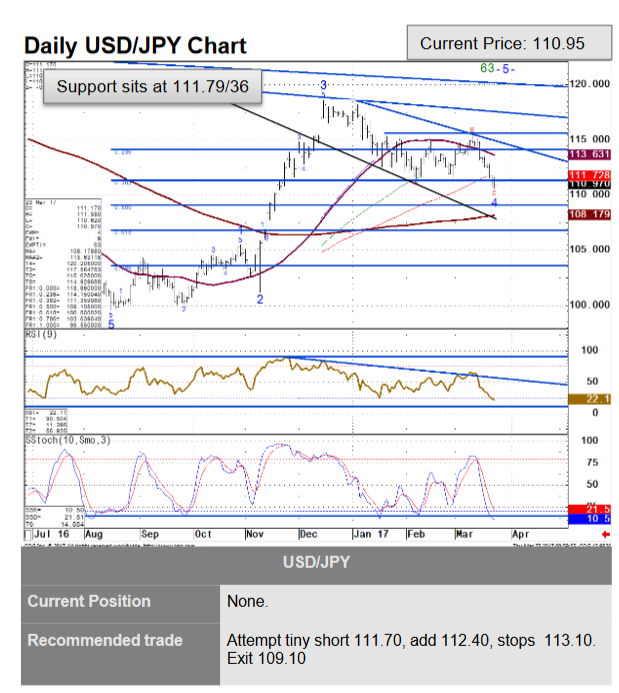
The USD/JPY had been in a strong uptrend in the latter part of 2016 but it has been steadily falling ever since it made a top at 118.17 in December.
The pair is currently at 111.15 after a further bout of weakness, however, analysts Karen Jones of Commerzbank sees the possibility of a recovery from here back higher towards the 118 highs again.
“Please also note that the Elliot wave count on the daily chart suggests that this is the end of the down move.”
She reiterates the point in her longer-term analysis, saying:
“The market has based. Targets are 118.66, then the 125.86 2015 high (long term).”
She refers to the Elliot Wave count, which we have also touched on elsewhere in our analysis.
Elliot waves are composed of five component waves. They are fractal, which means they themselves are sub waves of larger five-wave structures which evolve and diminish ad infinitum.
The five waves consist of three waves in the direction of the main trend, 1,2 and 3, and two intervening waves, 2 and 4, which are corrective.

Once the five waves finish, a three-wave correction (labelled a-b-c) unfolds before a new pattern starts forming.
On USD/JPY there appears to be a clear Elliot Wave which began moving higher in August 2016, formed a wave 1 peak at the start of November, then pulled back in a shallow wave 2, before peaking in a wave 3 at the December 118.66 highs.
After that, it has fallen back most recently in a wave 4, which Jones says is bottoming now.

If wave 4 is truly over then the pair should start to recover from its present level and move back up to match the 118 highs at the very least, if not possibly surpass them.
Other Studies Still Bearish
Although Jones is bullish the pair from the perspective of Elliot Wave analysis it would be unrepresentative not to include her other points. She is not as bullish when commenting on the pair in general.
“USD/JPY is near term neutral to negative. The cross is near term neutral to negative. The cross has eroded the 111.79/36 support zone, made up of the two-month support line, the February lows and 38.2% Fibonacci retracement. It has also started to erode the weekly cloud (111.38). This leaves it vulnerable to further weakness to 109.10 the 50% retracement and the 108.21 200-day MA,” said the Commerzbank analyst.
Of particular concern in her commentary is the erosion of the weekly cloud at 111.38 as this could signal a significant market turn.
The 200-day at 108.21 is another major level below the current market level which will surely provide strong support if it is reached and is not likely to be easily broken.


