
GBP/USD Correction Risks Rise: City Index
- Written by: Fawad Razaqzada, analyst at City Index

Image © Adobe Images
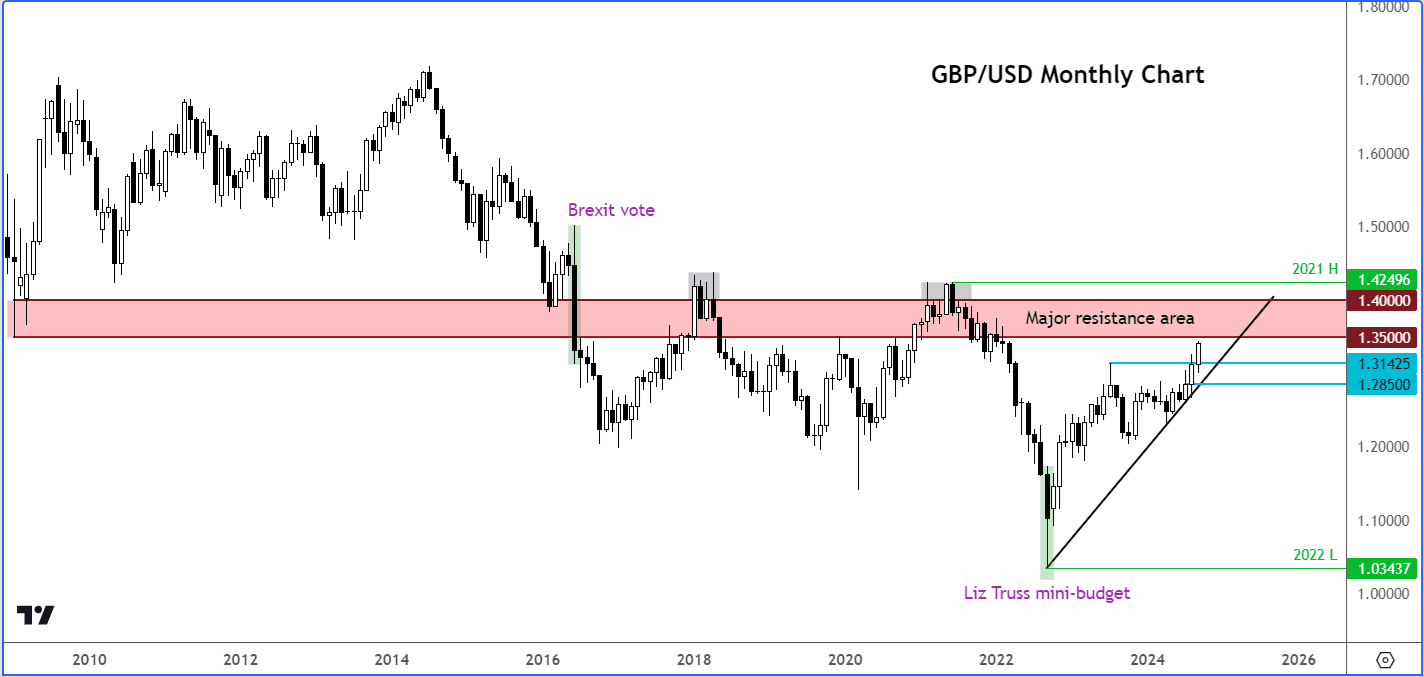
Year-to-date, the GBP/USD is up about 5.3%. While the potential to extend these gains is there, the cable is now less than 70 pips away from testing a key long-term resistance zone between 1.3500 and 1.4000.
Since the 2016 Brexit vote, this range has acted as a ceiling, repeatedly rejecting the pair’s attempts to break higher, even if we have had a couple of temporary breaks above this zone.
As rates approach the key 1.35-1.40 long-term resistance range, the upside could be limited moving forward.
The GBP/USD has been steady in the last few trading sessions, holding onto the decent gains it has made in Q3.
Unless we see a surprise 2% drop today, the cable is on track to close higher for the third consecutive month.
A slew of important US data—including the monthly jobs report—is on the horizon this week, and the cable’s near-term direction hinges on these economic releases.
While the broader US dollar trend remains bearish, the GBP/USD outlook is not so certain.
With much of the dollar weakness already factored in, a pullback in the cable could be on the horizon as we approach this week’s US employment data.
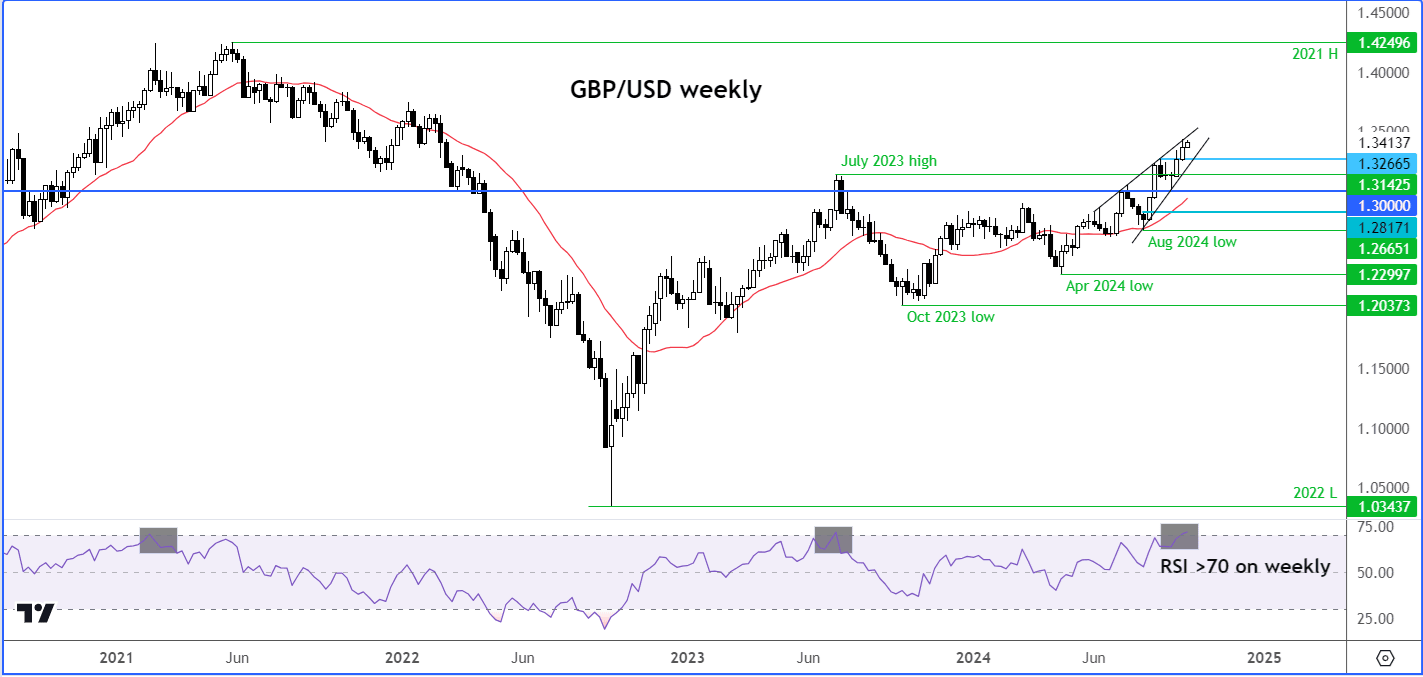
The weekly chart (see above) shows that price is approaching overbought levels. Momentum indicators like the Relative Strength Index (RSI) suggest caution as it climbs above the 70.0 threshold.
The last couple of times that the weekly RSI has climbed above 70, we have seen significant drops in subsequent months.
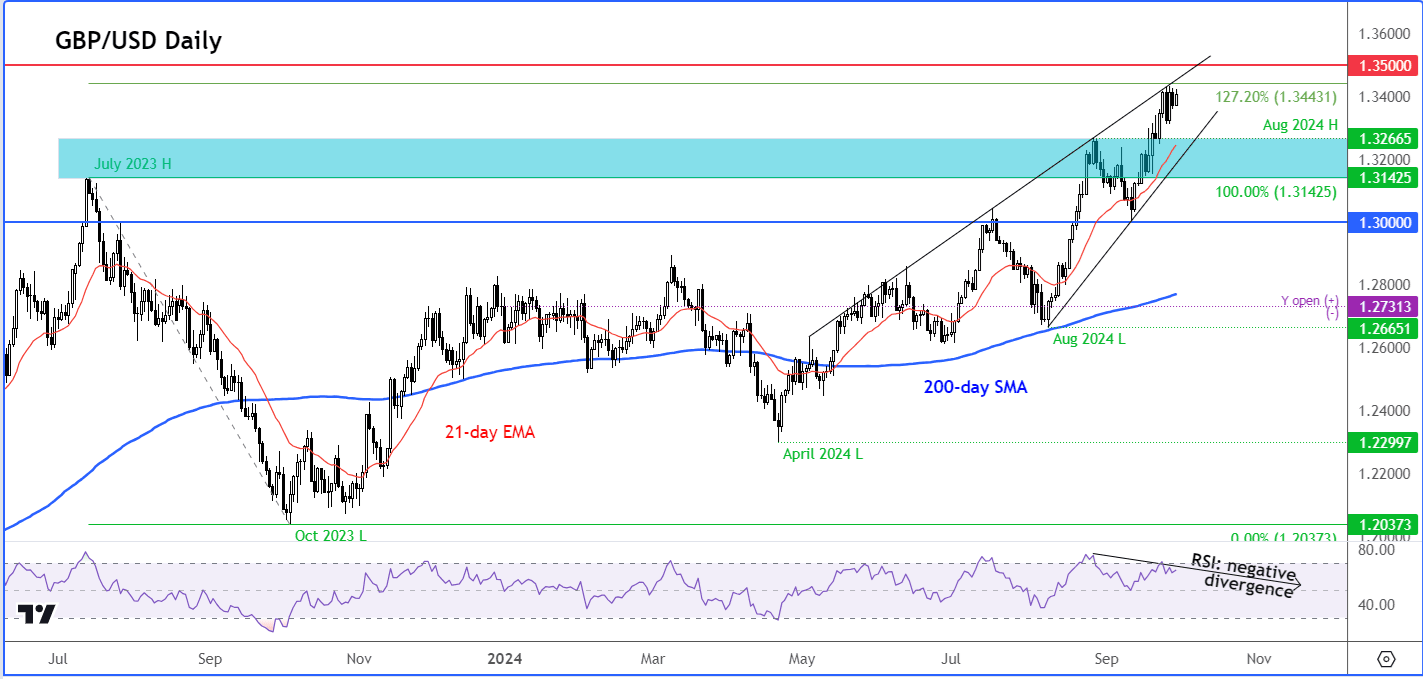
On the daily time frame, the RSI is in a state of negative divergence – i.e., it is forming a lower high relative to the underlying price making a higher high. This is considerable to be a sign of waning bullish momentum.
While the momentum indicators are signalling overbought conditions, what is missing so far is the bearish reversal signal on what matters the most: price. The GBP/USD has not yet created a bearish price pattern to encourage the bears to short it.
The series of higher highs and higher lows must end before the GBP/USD outlook turns bearish. Therefore, the overbought conditions, at this stage, should be viewed as a warning for the bulls that we could see some profit-taking or some short-term weakness. The bears will need to remain patient until a clear reversal signal emerges.
Key short-term support comes in around 1.3265, a level that had marked the high in August.
Below this level, 1.3200 is the next support to watch followed by the Jul 2023 high of 1.3142 – once resistance, this level may now offer support on a pullback.
But given those RSI overbought conditions on higher time frames, it is possible we could see a deeper drop than these levels before the GBP/USD becomes attractive again.


