Pound vs. New Zealand Dollar in the Week Ahead: Rising to Top of Range

Image © Adobe Stock
- GBP/NZD gets a boost from progress on Brexit deal and poor NZD confidence data
- Pair now back above 1.95 but still trapped in range
- The main release for the Pound is PMI whilst for NZD diary prices could figure highly
[Pre-market alert: We are seeing some interesting headlines concerning Michel Barnier who indicates he is "strongly opposed" to Theresa May's Chequers plan. Extraordinary comments that are clearly at odds with comments he made last week. Considering Chequers is the only plan in town it hints heavily at the UK and EU not reaching a deal. The market's reaction will be interesting.]
Sterling has rebounded strongly against the New Zealand Dollar after news of progress on a Brexit deal helped it higher whilst the Kiwi took a hit from a low in business confidence data.
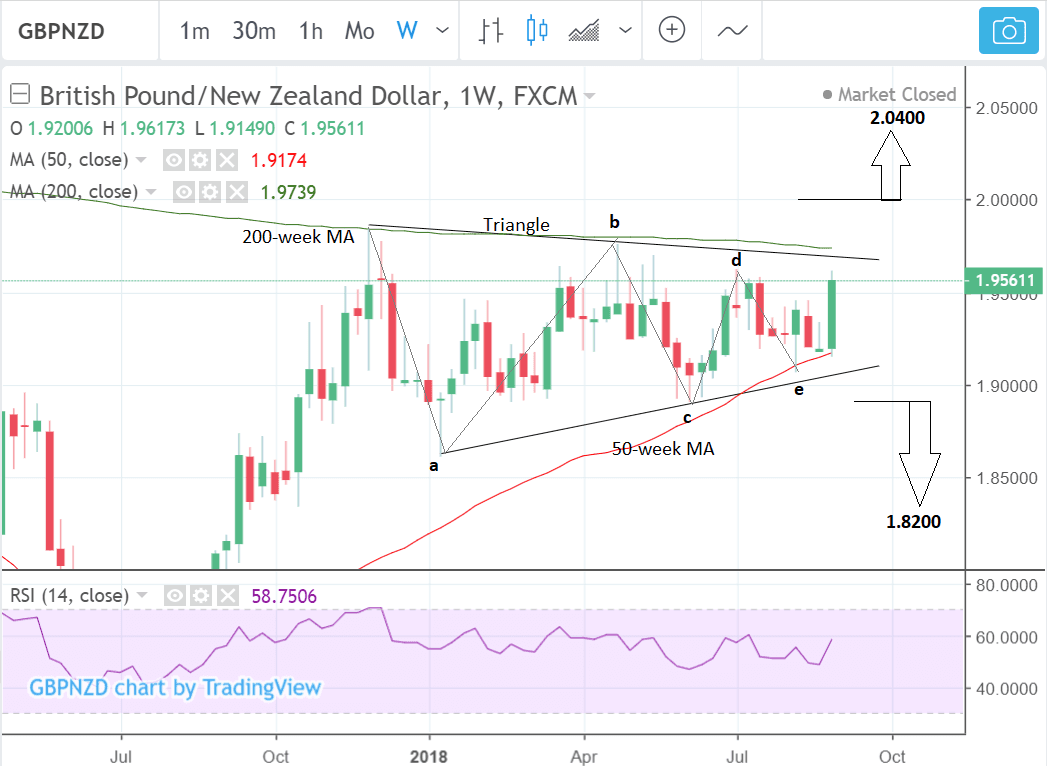
The Pound-to-New Zealand Dollar exchange rate has climbed back above the 1.95 level and is threatening to extend gains to the upper border of a long-term range which has formed since the November 2017 highs.
As a consequence the GBP/NZD exchange rate is currently at 1.9587 on the interbank market with quotes on international transfers at high-street bank accounts being seen between 1.8921 and 1.8999 while independent specialists are offering towards 1.9391.
From a technical standpoint the exchange rate is still trapped in a trading range resembling a triangle pattern, and although it has oscillated within the confines of this range for several months now, a volatile breakout is expected on the horizon.
GBP/NZD has now completed the minimum five waves required for a pattern to qualify as a triangle, and although some triangles are composed of 9 waves, these are relatively rare and the probabilities suggest a breakout is probably close at hand instead.
Breakouts from triangles are vertiginous and volatile. In the case of the current triangle the eventual breakout could happen in either direction.
An added complication is that the upper and lower boundaries of the triangle are 'reinforced' with the 200 and 50 week moving averages (MAs) respectively, which pose formidable obstacles for the exchange rate to overcome.
Major moving averages tend to repel price action because they attract short-term technical traders who often fade any approach.
A breakout higher would require more-than -usual confirmation because the 200-week MA is in the way, but a move above 2.00 would provide it and could take the market all the way to an upside target of 2.04.
Likewise a break lower would require a greater degree of confirmation because of the situation of the 50-week MA providing underpinning support at the bottom of the range, as such we would be looking for a break below 1.89 to signal a downward move toward the target at 1.82.
Triangle breakout targets are generated by extrapolating the height of the triangle at its widest part, by a ratio of 0.618 from the breakout point.
0.618 is known as the 'golden ratio', a mathematical constant found to govern proportionality in natural phenomena and also in financial market price movements.
The trend prior to the formation of the triangle was bullish, which suggests a marginal bias toward an upside breakout and continuation higher. However, the fact the component waves of the triangle are steepest on the way down also suggests a bias for a downside breakout.
Advertisement
Get up to 5% more foreign exchange for international payments by using a specialist provider to get closer to the real market rate and avoid the gaping spreads charged by your bank when providing currency. Learn more here
The New Zealand Dollar: What to Watch
A major release for the Kiwi in the week ahead is data on prices for dairy products established at The Global Dairy Trade Auction (GDTA) on Tuesday, September 4, at 15.30 B.S.T.
The data is important for the New Zealand Dollar as dairy products are New Zealand's main exports and increases in dairy prices tend to increase demand for the Kiwi and drive up its value.
The last GDTA on August 21 revealed that the price of New Zealand's single largest dairy export Whole Milk Powder fell - 2.1%, to an average price of US$2,883 per metric tonne, this compares to a price of over US$3,232 only in March, a sizeable -10.8% decline in the 5-months since then.
Further weakness in the price of dairy products and whole milk powder is likely to weigh on the Kiwi because it reduces aggregate demand from importers for kiwi Dollars, and because it is negative for New Zealand dairy farmers who are already struggling due to squeezed profit margins.
The auction covers 10 different dairy products in all including Anhydrous Milk Fat, Butter Milk, Butter Milk Powder, Cheddar, Lactose, Rennet Casein, Skim Milk Powder and Whole Milk Powder - the headline decline was for the index or basket of all 10 goods.
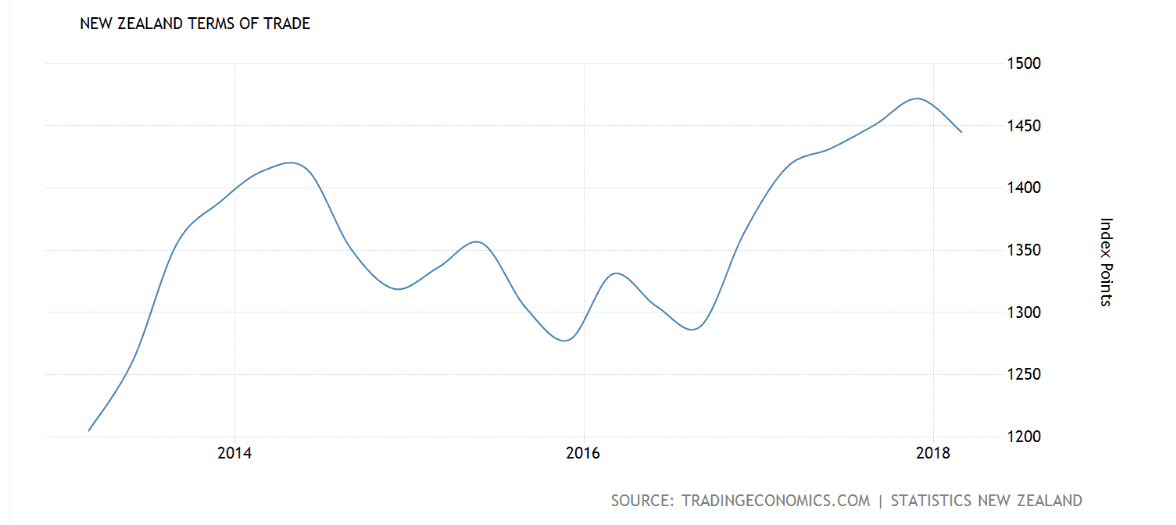
Another major release for the Kiwi in the week ahead is terms of trade data which shows the difference between the average cost of new Zealand's exports versus its imports.
This too can have an impact on the Kiwi because it represents a gauge of how aggregate demand for the currency from importers compares with demand for other currencies from exporters.
The release is out at 23.45 on Sunday, September 2, and is forecast to show a 1.0% rise in terms of trade in Q2 compared to the -1.9% fall in Q1. A rise would be considered positive for the Kiwi Dollar and vice versa for a decline.

Advertisement
Get up to 5% more foreign exchange for international payments by using a specialist provider to get closer to the real market rate and avoid the gaping spreads charged by your bank when providing currency. Learn more here
British Pound this Week: The Calendar Heats up Again
Beware, politicians return to work from their summer holidays; cue the inevitable bickering on what Brexit should look like.
Therefore headline risks rise again and Sterling might prove sensitive to any notable developments. Of course, politics is impossible to call so we will be watching for the unexpected.
Rehashing our #Brexit scenario analysis. We're edging to a world where there are solid signs of progress (upper left quadrant). There are near-term UK political hurdles to still overcome - which may keep $GBP upside in check. But growing confidence that short $GBP not attractive pic.twitter.com/UJfkCo9Ar4
— Viraj Patel (@VPatelFX) August 29, 2018
The calendar does however have some economic releases to watch as the new month commences.
The main releases to watch in the week ahead are manufacturing, construction and services Purchasing Manager Indices (PMI) data for August.
PMI's provide relevant, timely, data which often provides a reliable guide to future, broader, economic trends.
Manufacturing PMI is expected to slip from a 3-month low of 54.0 in July down to 53.8 in August when it is released at 9.30 B.S.T on Monday, September 3.
Manufacturing PMI has been in decline recently and further greater-than-expected weakness could weigh on Sterling, but as long as it remains above 50 - the level which differentiates expansion from contraction - it is unlikely to heavily influence the exchange rate.

Image courtesy of tradingeconomics
The construction PMI is less significant than the other two but it is released at the same time on Tuesday and is forecast to fall to 54.9 in August from 55.8 in July.
Services PMI is the most important release of the three as this sector accounts for over 80% of the UK's economy - economists are forecast a rise to 53.8 in August from 53.5 previously, when it is out at 9.30 on Wednesday. It is showing a more resilient if volatile progression.

Image courtesy of tradingeconomics.
Another key release for the Pound in the week ahead is the British Retail Consortium (BRC) retail sales monitor, which provides a useful leading indicator for broader high-street sales.
Halifax house price data for August is forecast to show a -0.2% fall compared to July but a 3.9% rise compared to August last year, when it is released on Friday at 8.30.
Although fluctuations in house prices can alert economists to the onset of deeper economic malaise with repercussions for Sterling, they have remained resilient of late and continue to rise overall.

Image courtesy of tradingeconomics.


