Indian Rupee to Rise says one of the Currency's Best Analysts
- Rupee is going higher after long period of decline
- 67 eyed as initial target for USD/INR
- Charts show GBP/INR also vulnerable if 50-day MA can be breached

Image © Adobe Stock
The Rupee is set to recover, a prominent analyst of the currency has said.
A slump in crude oil prices and a peaking Dollar are the two fundamental catalysts for the rebound, says Aditya Pugalia, director of financial markets at Emirates NBD, and the "top forecaster of the Rupee" according to Bloomberg News.
Pugalia forecasts USD/INR to fall to 67 from its current level in the mid-68s on the back of the change in key fundamentals.
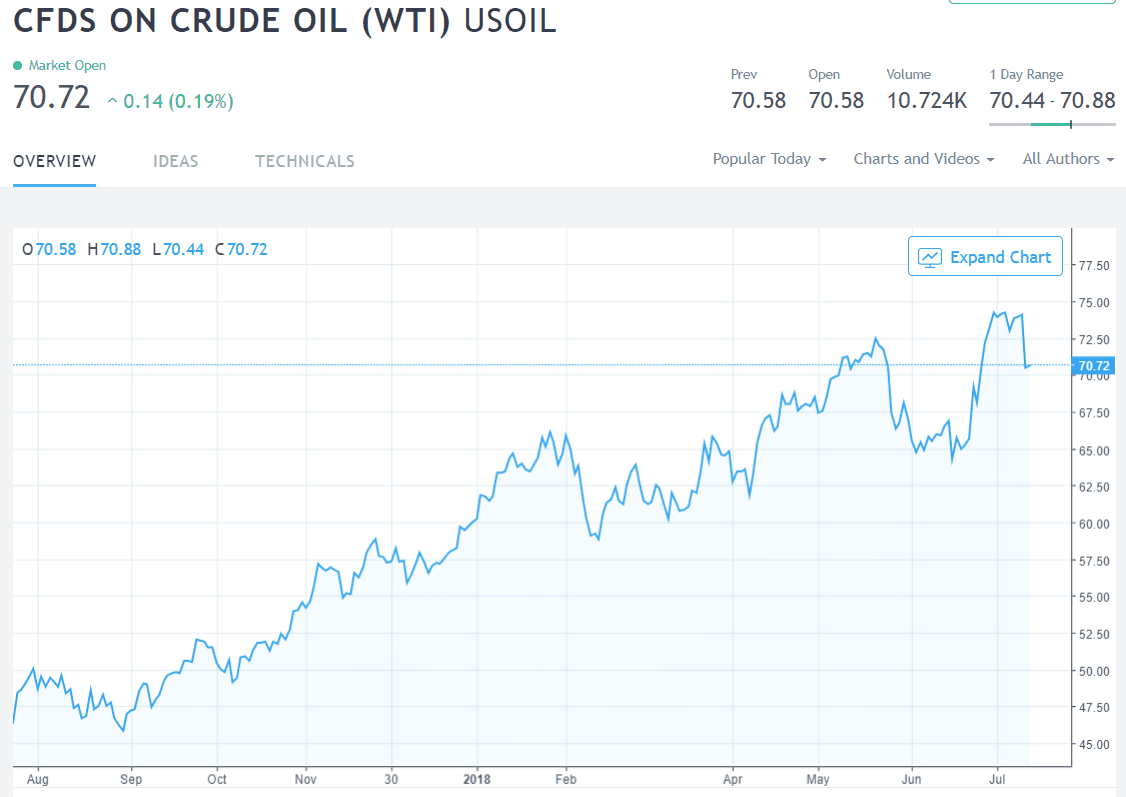
The call follows a slump in oil prices on Wednesday when WTI Crude fell from $74.66 to $70.00 per barrel. Oil is a kek factor in the determination of the Rupee's value since it accounts for 27% of the countries imports.
The recent rally in oil has, therefore, increased the country's import bill and necessitated more Rupee selling to balance it.
The Pound meanwhile looks marginally vulnerable against the Rupee from a technical perspective, with a few important caveats.
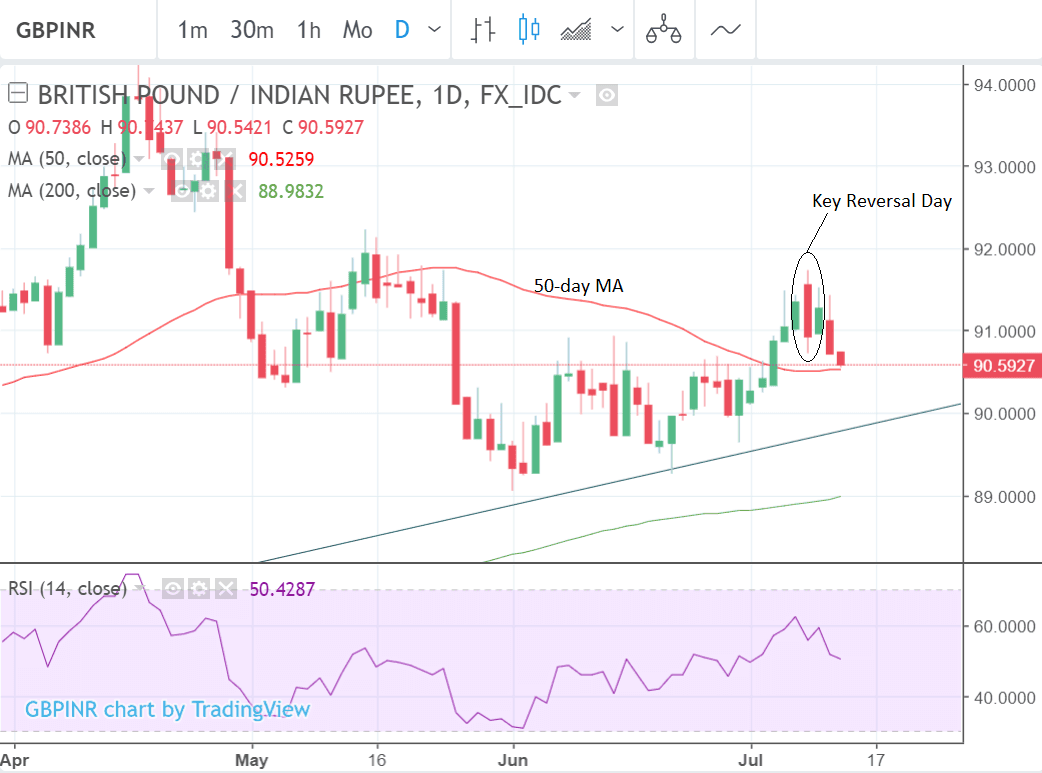
A bearish key reversal day for GBP/INR at the recent peak suggests a pivot of the trend and further Rupee strength, however, the position of the 50-day moving average (MA) at the current lows is a major obstacle for bears.
50-day MA's often prevent the extension of price trends. Sometimes they even lead to complete reversals of the trend, so there is a possibility the exchange rate could start rising from it's present location on the 50-day, which would suggest GBP out-performance of INR.
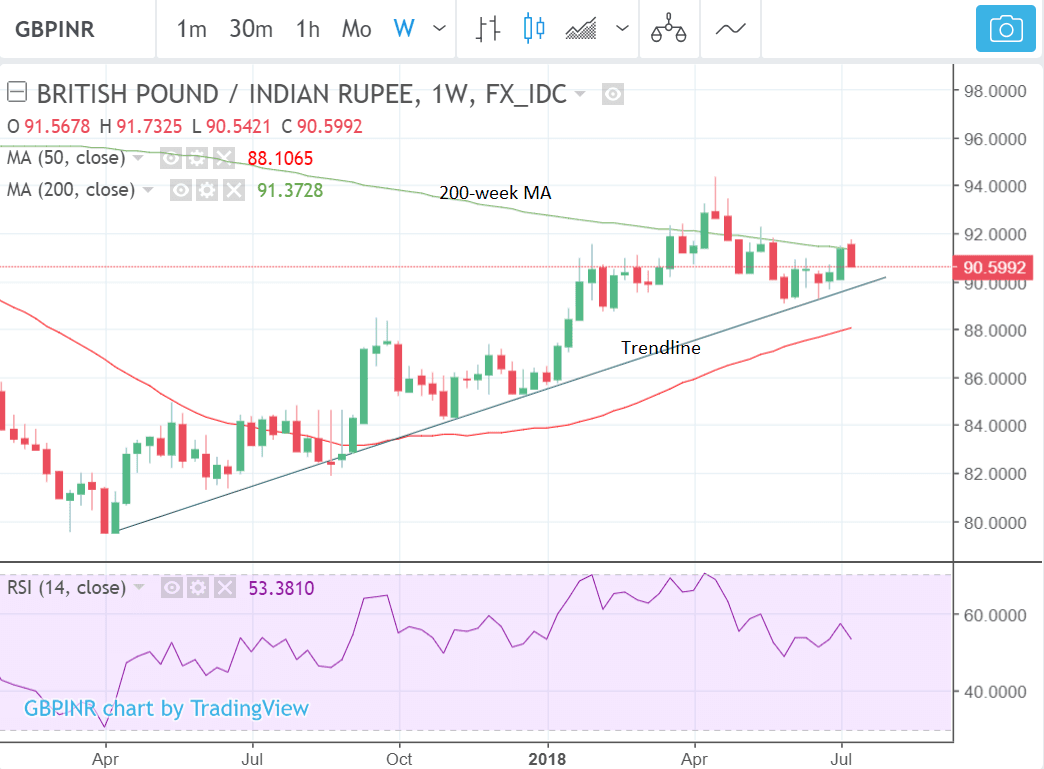
The weekly chart is more bearish but not definitively so. It shows the exchange rate resting on a major trendline drawn from the April 2017 lows. Price looks poised to break lower and if it is successful in piercing the trendline a much stronger bearish phase will ensue.
On the weekly chart the major 200-week MA is performing the same function but in reverse to the 50-day MA - it is capping the market and preventing further gains at last week's highs of 91.37 - and so far appears to have been successful, given the sell-off this week.
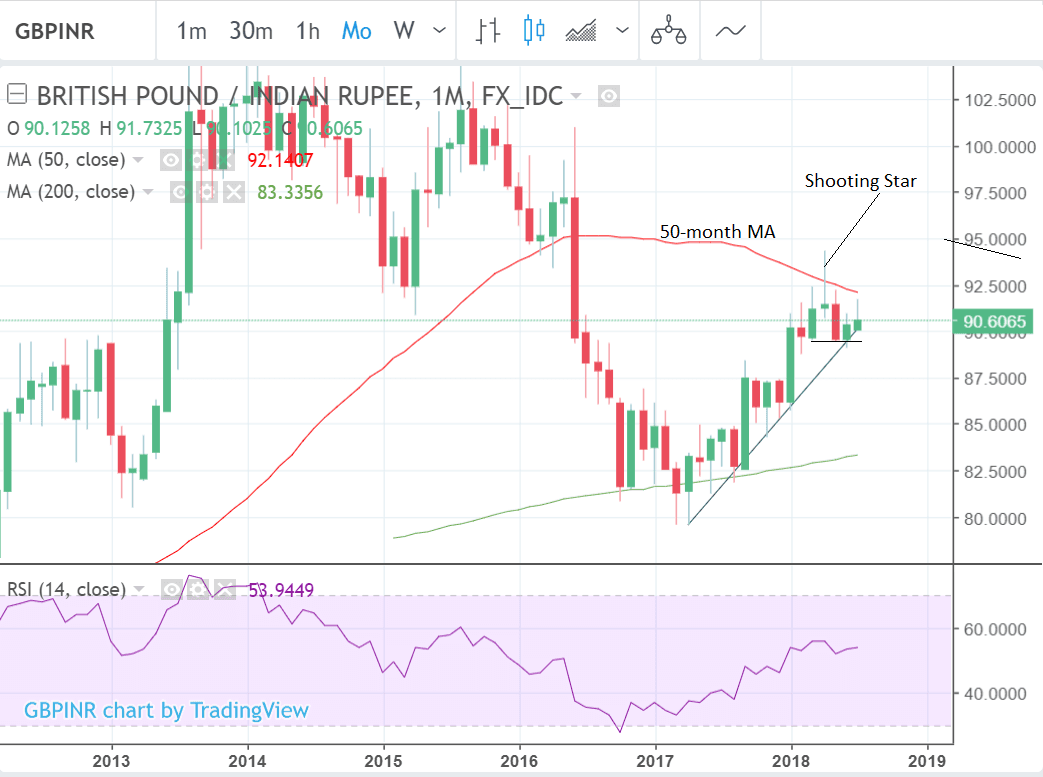
Finally, the monthly chart is bearish. The pair looks like it has probably reversed trend after forming a shooting star at the 50-month MA April highs. In June it broke below the March lows to provide a strong long-term, trend reversal, bearish, sell, signal for GBP/INR, which indicates the market will probably move lower long-term.
Rising core inflation in India prompted the Reserve Bank of India (RBI) to change their neutral stance and raise interest rates in June, and more hikes are predicted in the pipeline.
If interest rates do rise further it will probably lead to an appreciation of the Rupee as higher interest rates attract greater inflows of foreign capital, drawn by the promise of higher returns. This could be a further factor supporting Pugalia's stronger Rupee thesis.
Advertisement
Get up to 5% more foreign exchange by using a specialist provider to get closer to the real market rate and avoid the gaping spreads charged by your bank when providing currency. Learn more here


