Pound-to-Rupee Rate Technical Update and Forecast
- GBP/INR in a long-term uptrend which is expected to extend
- Daily chart is constructive as new trading week begins
- Subtle signs of weakness could warn of future volatility

© kasto, Adobe Stock
GBP/INR continues to be contained by a glass ceiling at 92.00 as the new trading week begins.
One Pound buys 91.65 Indian Rupees on the interbank market at the time of writing, after rising slightly on Monday morning from the previous week's 91.46 close.
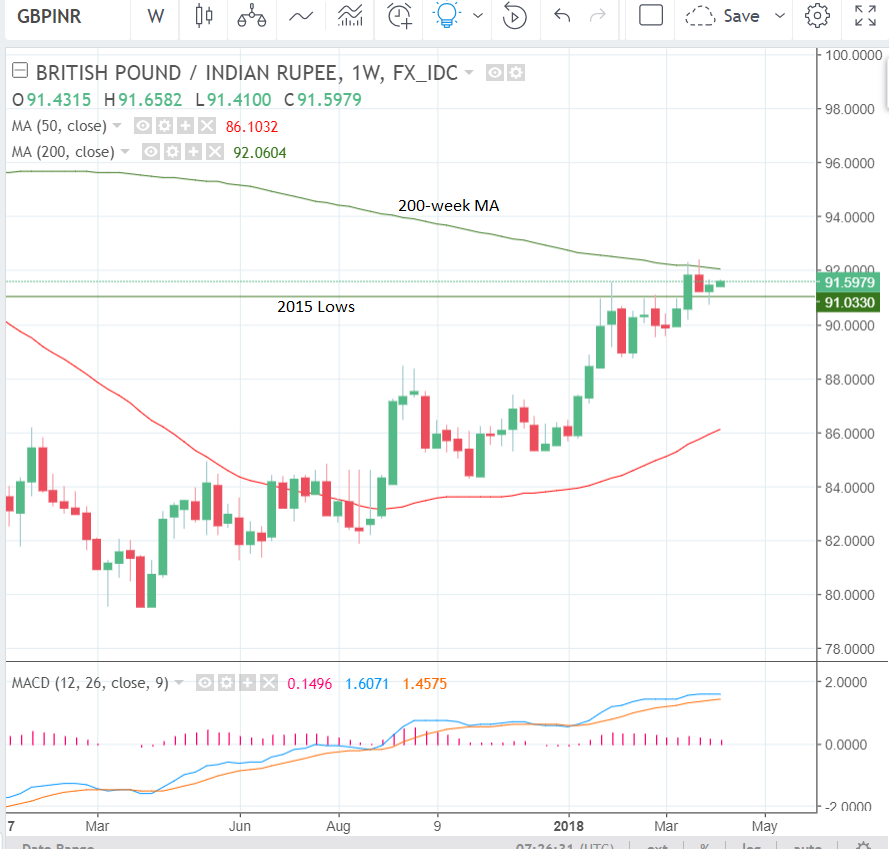
On the weekly chart (see below) we note the pair is in a medium-term uptrend and given there are no overwhelming signs of weakness yet (there are some early warning signs but they are not yet very developed so we will cover them later) we expect the pair to continue rising, since as the age-old dictum goes, "the trend is your friend until the bend at the end."
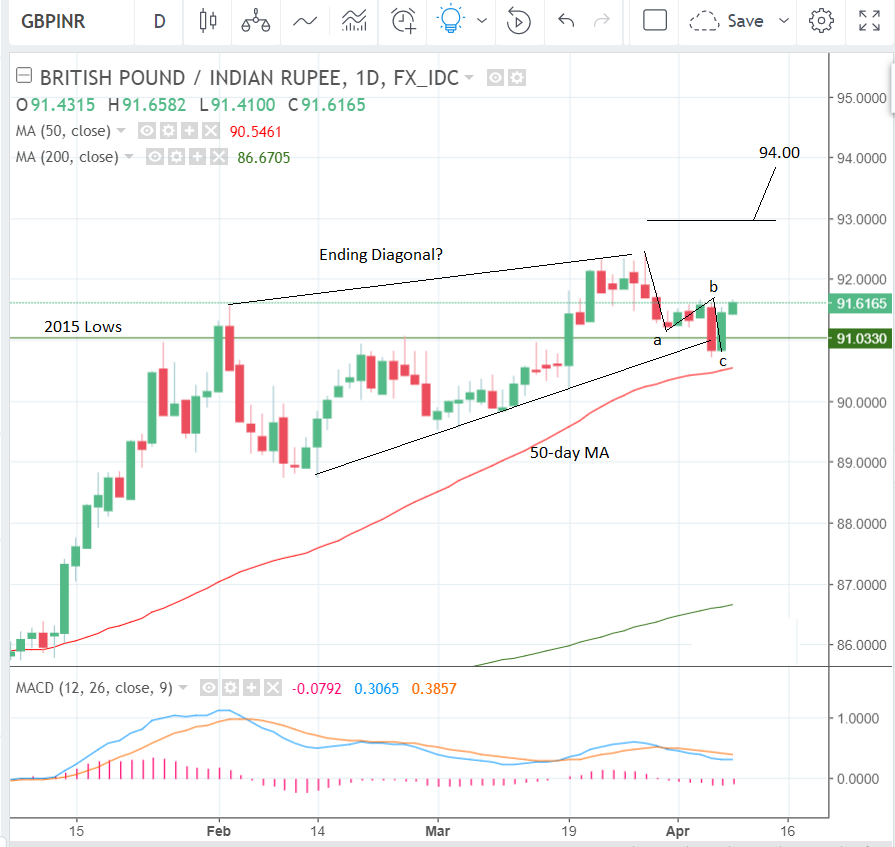
If we now look at the daily chart it shows further signs of upside potential. The pair has been correcting back from its March 28, 92.41 peak over recent weeks and has formed an ABC corrective pattern in the process.
ABC patterns are common corrective phenomena which normally lead to a resumption of the trend higher after they have finished.
This is what we expect to happen with the ABC pattern on GBP/INR.
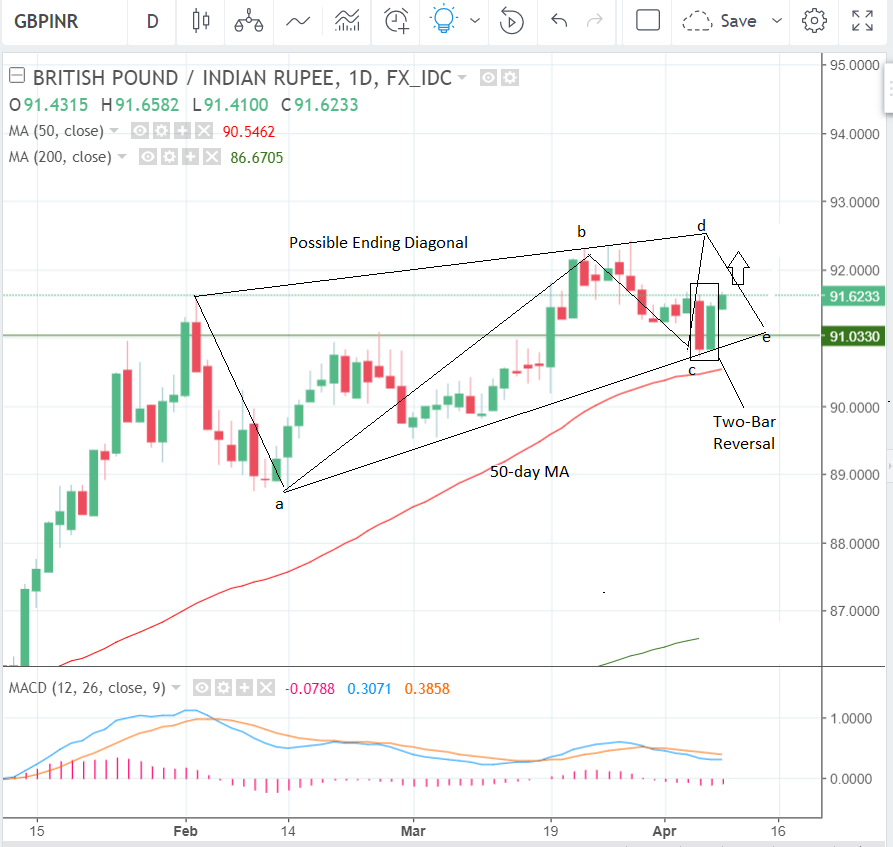
There is further evidence that a resumption of the uptrend may be taking place in the form of the two-bar reversal pattern which has formed at last week's lows (boxed on chart below).
Two-bar reversals occur when prices are in a downtrend and relatively long down-bar forms which is followed immediately by a relatively long up-bar of about the same length.
The chart below shows an example of how a two-bar reversal can mark the inflection or reversal point in a downtrend.
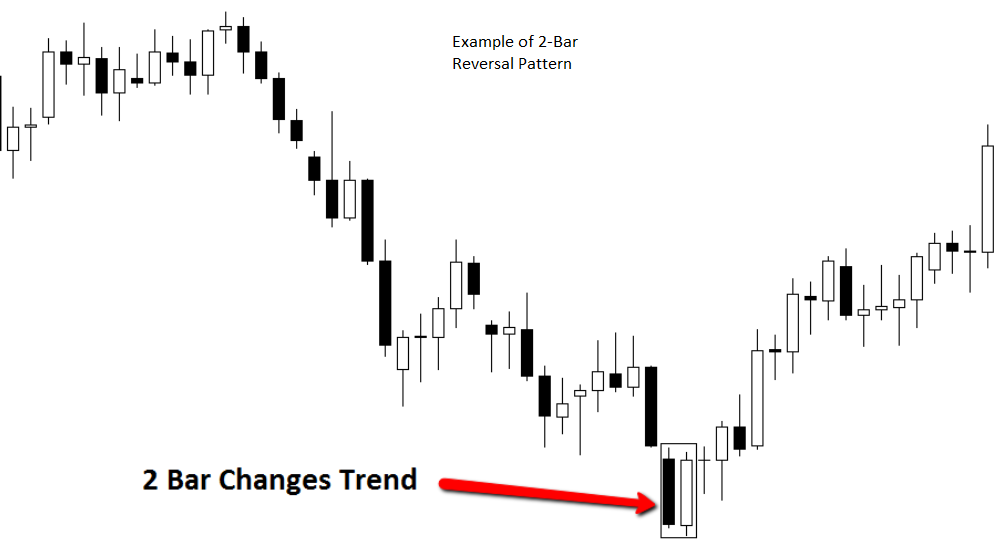
Image courtesy of DailyForex.com
This pattern seems to indicate the likelihood of a move higher starting. Indeed, this morning the pair has obeyed the signal so far and started rising.
The probabilities support it continuing higher, although we do not see it rising very far and upside is likely to be capped by a ceiling of resistance from the 200-week MA at 92.06 or thereabouts.
Trending prices often stall, pull-back or even sometimes reverse at the level of large moving averages like the 200-week, because it is used by large speculators, fund managers and retail traders alike as a decision-making tool, and is therefore subject to an increased level of volatility.
For confidence the trend higher was extending we would want to see a break above 93.00, which would guarantee a clearance above the MA, and then probably see the pair ideally reach an initial target at 94.00.
The pair may also be forming a bearish topping pattern on the daily chart, called an ending diagonal (see chart below).
Ending diagonal's are comprised of five component waves (labeled a-e) and always precede a steep drop in prices. The diagram below shows an example of an ending diagonal and the extreme volatility which comes after it completes.
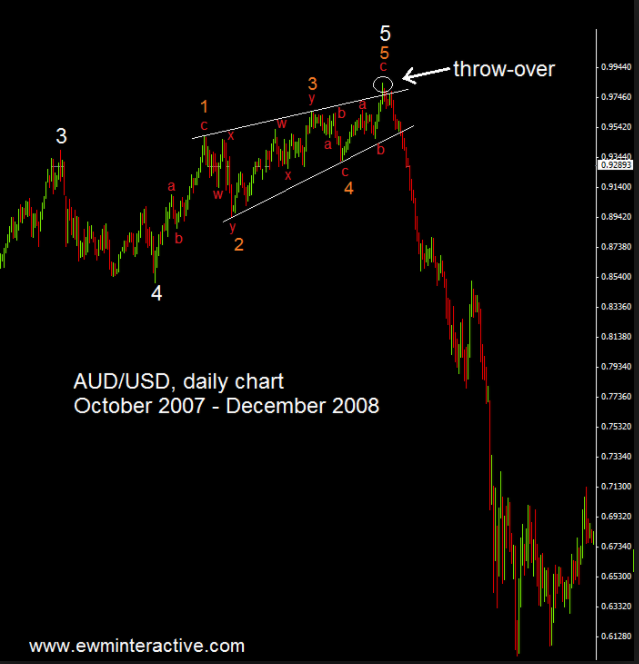
To conclude, if there is an ending diagonal forming on GBP/INR it will probably result in a fairly violent breakdown similar to the one in the chart above, so bulls beware!
Get up to 5% more foreign exchange by using a specialist provider to get closer to the real market rate and avoid the gaping spreads charged by your bank when providing currency. Learn more here.

