Pound Looking Very Bullish Against the Canadian Dollar Longer Term Show Chart Studies

The Pound has risen sharply versus the Canadian Dollar in recent weeks as UK economic data confirms the economy remains robust and markets see the prospect of the Bank of England bringing forward the timing of their first interest rate rise in years.
GBP/CAD has been rising since mid-January from lows towards 1.58 through to the 1.6780 we are seeing at present.
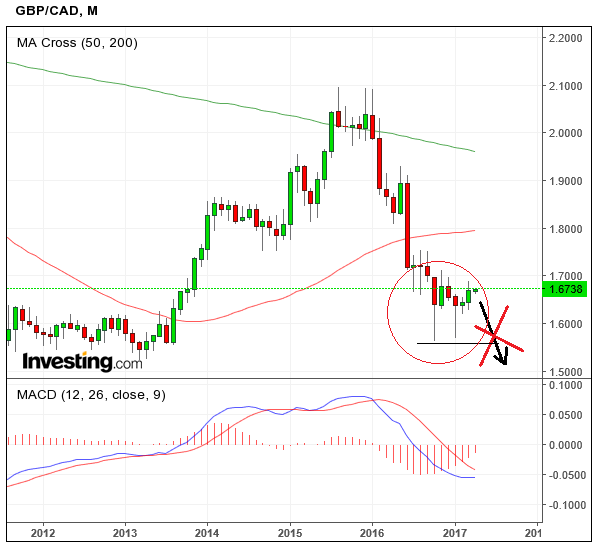
Understandably then, the longer-term monthly and weekly charts continue to place a bullish bias on the forecast for the pair as it edges higher.
On the monthly chart, we note the recent hammer candlestick pattern in January providing a very bullish signal as well as the October 2016 month, which also has a ‘hammer-like’ look and feel.
The Hammer is a Japanese candlestick pattern which occurs when the exchange rate rejects a low, recovers and closes near the high of the range, forming what looks like a 'hammer'.

It looks extremely unlikely that the exchange rate will fall below the lows of these two candles, thus providing a generally positive backdrop for the pair’s longer-term outlook.
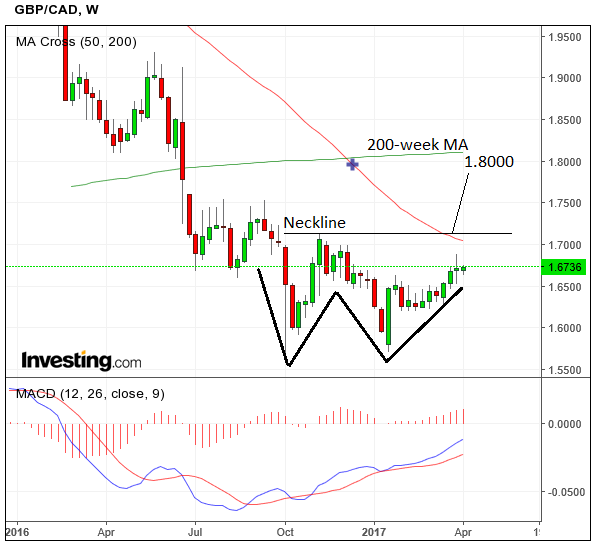
Zooming in a bit to the weekly chart and we note how the pair has formed a double bottom reversal pattern.
Double bottoms are made up of two troughs at roughly the same level, forming a shape much like the letter ’W’.
The pattern is a bullish reversal sign which is activated when the exchange rate crosses its the intervening peak between the two troughs, which is known as the ‘neckline’.
The price expectation from such a move would be to rise the same height as the pattern extrapolated higher again from the level of the neckline.
This indicates a target at above 1.8000, the target we have chosen because it is at roughly the level of the 200-week moving average, a level likely to inhibit further upside.

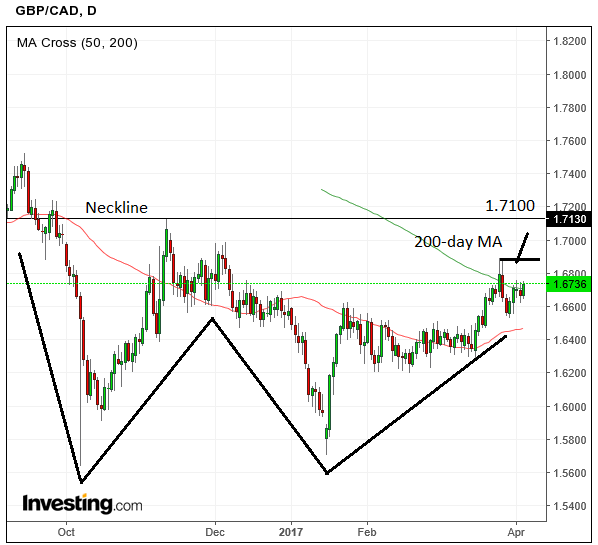
On the daily chart, the exchange rate looks less bullish, having pulled back quite steeply from the 1.6900 highs after a tweezer top reversal pattern formed there.
Although it has renewed its bullish course in recent days, we would want to see confirmation from a break above the 1.6900 highs before advocating an extension.
Nevertheless, such a break would probably move higher towards a target just below the neckline at 1.7100.
Strategist Shaun Osborne, at Scotiabank is also bullish:
“The broader trend is bullish with a sequence of higher lows from October and a bullish resolution to the triangular consolidation from late January through mid-March. Momentum signals are bullish, DMI’s are confirming, and the short-term MA’s are bullishly aligned. We look to further gains targeting 1.70 and the November high near 1.7120.”


