When it Comes to the Pound, Gilt Yield Curves Don't Flatter
- UK yield curve flattest for 2-years, suggesting subdued GBP outlook.
- Comparison with other curves yields clues about currency direction.
- Eurozone, US curves are also flat, with implications for EUR and USD.

© Goodpics, Adobe Stock
The UK government bond yield curve is at its flattest since 2016 amid growing expectations the Bank of England (BOE) will raise interest rates and increasing Brexit uncertainty.
A flatter yield curve bodes ill for Sterling as it reflects lower long-term growth expectations due to Brexit risks. Currencies generally like the steeper yield curves.
The yield curve is plotted using bond yields of differing maturities, starting with the shortest and ending with long-term 30-year bond.
Yield is the compensation investors get for for holding debt and is heavily influenced by inflation expectations. In a healthy economy where expectations are for steady growth and rising inflation over the medium and longer-term, the curve is relatively steep.
The curve for UK gilts, however, is flatter than it has been for a long-time. The effect is most clearly visible in the difference between 2-year and 10-year gilt yields, a common barometer of the curve.
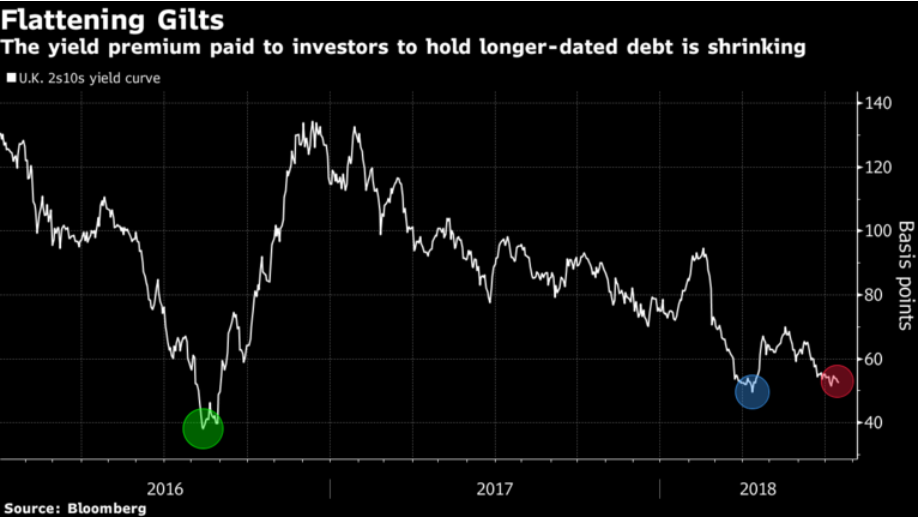
The chart below shows how the difference, or spread as it is called, has narrowed markedly to just above 50-basis points during recent months.

Above: Bloomberg chart showing spread between 2 and 10 year UK Gilt yields.
"The yield premium on 10-year gilts over two-year ones almost halved in the past year to 52 basis points as opposing forces acted on the two tenors," says John Ainger, a correspondent for Bloomberg News.
"Short-dated rates have been boosted by expectations that the Bank of England will raise interest rates as early as August, even as longer-maturity ones were weighed down by Brexit uncertainty and domestic political turbulence," says Aiger.
"Upward slopes are associated with future inflation (appreciating currency, rising yields, growth), while downward slopes are related to depreciation, and economic contraction," says information and education website Forextraders.com.
Forextraders says the flat yield curve can be either a sign the yield curve is transforming to another type (upward sloping to downward, and vice versa), or a protracted period where the present conditions will be maintained (such as inflation, yields, and growth).
The website recommends comparing the yield curves of different currencies to help forecast how they will compete against each other in pairs.
"Since currency trends are strongly dependent on perceptions about future rates, as well as present yield differentials between nations, comparing the yield curves of two nations will give us a better idea on the attractiveness of a particular currency for a particular profile of investors," says Forextraders.com.
Using this approach we should compare the gilt curve with the German bund curve (used as a proxy for Eurozone-wide rates) for a handle on where GBP/EUR might be going.
Yet the bund curve is also flat according to a recent report from Reuters in which the new agency stated that the "German Yield Flattens...As German bond yields fell, the gap between two- and 10-year borrowing costs was at its narrowest in over a year."
This suggests the Euro is in the same boat as the Pound, and the lack of difference in outlook is reflected in the prolonged sideways market mode GBP/EUR has been yo-yoing in since autumn 2017.
In the US the yield curve for the equivalent to Gilts, US Treasury Bonds (UST) is even flatter with the difference between 2 and 10-year USTs even narrower at 30 basis points (yesterday) than in the UK.
The curve in the US is flat for different reasons to the UK, however, and is exhibiting "classic late cycle behaviour" according to David Ader, a correspondent at Bloomberg News.
"This is classic late-cycle behaviour. The curve is signalling that the market thinks the Federal Reserve’s interest-rate increases, which are driving short-term yields higher, will not only slow inflation, but could also tip the economy into recession, causing long-term yields to go nowhere or even fall," says Ader.
The reasons for the flat curve echos the view of J.P. Morgan, which recently stated that it expected growth in the US to slowdown after the current "sugar high" from Trump's tax cuts wears off in about 12 months, and that this boded ill for the Dollar in the medium-term.
Advertisement
Get up to 5% more foreign exchange by using a specialist provider to get closer to the real market rate and avoid the gaping spreads charged by your bank when providing currency. Learn more here


