S&P 500 Could be on Cusp of a Correction: City Index
- Écrit par Fawad Razaqzada, analyst at City Index
-

Image © Adobe Images
The trend is not bearish yet but has the potential to turn that way should we see the breakdown of a few important support levels, writes Fawad Razaqzada, analyst for City Index and Forex.com.
The ongoing sell-off in crude oil has had negative implications for other commodities, with copper and silver both dropping further lower and that, in turn, has caused some commodity stocks to extend their falls.
Demand concerns have been intensified by weak US factory data we saw on Monday, which again showed activity in the sector fell in contraction unexpectedly.
Today’s JOLTS data showed easing demand for labour, pointing to a weakening jobs market. While the data has caused bond yields to fall, this has been offset by concerns over economic and earnings growth.
Thus, stocks have not responded in the usual way of cheering on weaker-than-expected data. The questions, are we finally headed for a long overdue correction now? The S&P 500 outlook is not bearish yet from a technical viewpoint, but the potential is there for that to change in the coming days.
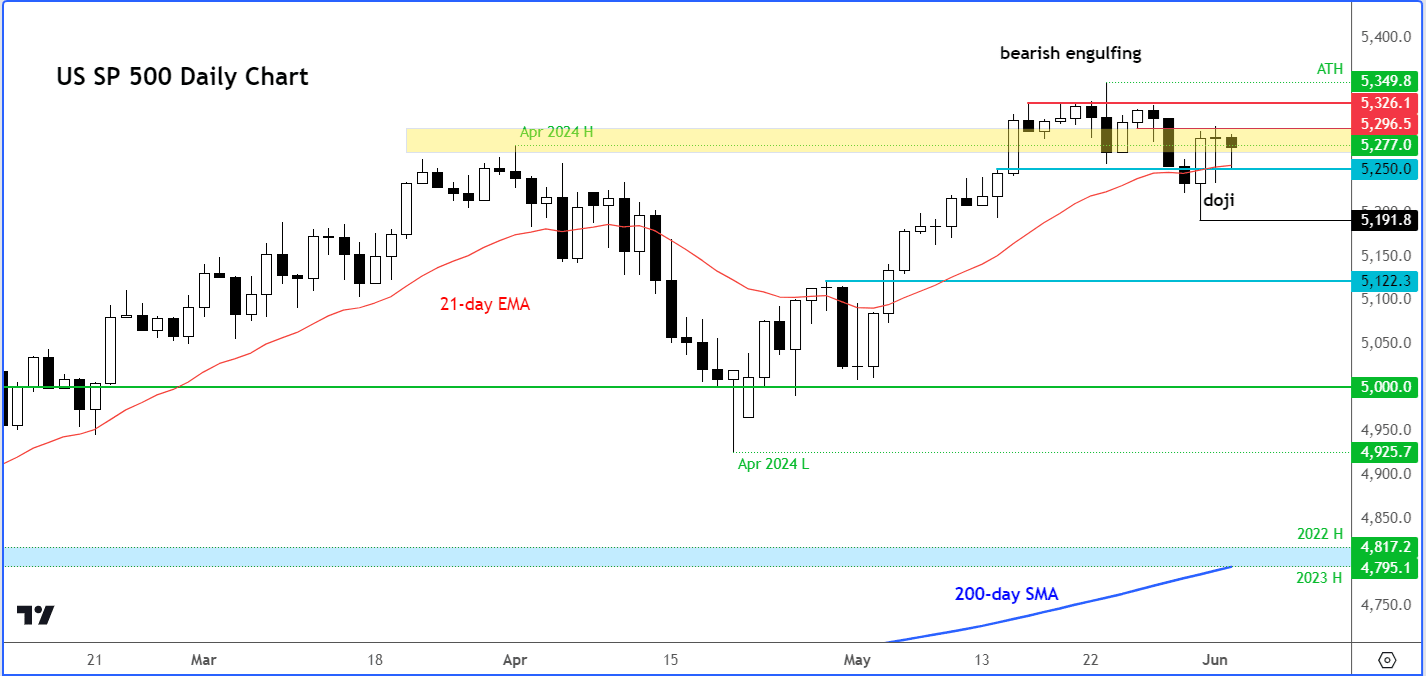
The bullish trend is losing its strength with markets moving into consolidation mode after the recent upsurge to a new record high above April’s peak of 5277 was met with some profit-taking pressure.
The trend is not bearish yet but has the potential to turn that way should we see the breakdown of a few important support levels.
Friday’s big recovery and rally should have led to some follow-up technical buying, but instead, we have seen the S&P drift lower from around 5296 resistance level. So far, support at 5250 has held firm, but a closing break below it today could make things interesting heading into the middle and business end of the week.
If we do see further weakening signs today, then watch out for a sharp move lower to take out trapped traders whose stops would be resting below Friday’s large bullish engulfing candle, at 5191. The next short-term level to watch below that is at 5122, which was the high point of April before the breakout in early May.
In terms of resistance, 5296 appears to be a key short-term obstacle. Above here, 5326 is the next potential resistance then there is nothing significant until May’s all-time high at just below 5350.
Adding to the above-mentioned concerns about the economy, investors are also happy to book profit ahead of a busy week for economic events. Risk appetite is also waning amid a lack of major fresh bullish catalysts. People are happy to book profits after what has been a strong year so far in the tech sector.
We have also seen some insider selling in big tech firms like Nvidia, which one cannot ignore. For months, the stock market rally has been driven by strong demand for technology shares, bolstering indices like the Nasdaq 100 and S&P 500 despite weaknesses in other sectors. However, technology shares now appear overextended, so a correction may be on the horizon.
After months of substantial gains and no new bullish catalysts, even the bullish camp would welcome a bit of a downward movement in stock prices to make them attractive again.
Thanks to consistently weak manufacturing data from around the world, demand concerns are the forefront of investors’ minds.
This week is packed with significant data releases. Key US macroeconomic indicators to watch include the ISM Services PMI, ADP private payrolls, and jobless claims data. However, the main focus is on Friday when the May jobs report will be published.
Today's highlight was the JOLTS Job Openings, which came in below the expected 8.40 million. Instead, it printed 8.06 million, down from a revised 8.36 million (initially reported 8.49 million) the previous month, indicating a potential softening of the labour market.
Meanwhile the RCM/TIPP Economic Optimism index fell to 40.5 from 41.8, missing expectations of an improvement to 45.2.