The Gold Price is Forecast to Rise Another 5%, With $1,800 and Above Possible in "Bullish Scenario"
- Written by: James Skinner
- Gold tipped to rise as technical and fundamental stars align.
- Gold stages upside break from symmetric triangle on charts.
- Could rise another 5% in three months, Commerzbank says.
- Julius Baer favours correction lower ahead of strong year end.
- Scotiabank tips $1,700 "soft ceiling," $1,800 "bullish scenario."

Image © Adobe Stock
- Spot rates at time of writing: GBP/EUR: 1.2038, -0.03% | GBP/USD: 1.2993 -0.08%
- Bank transfer rates (indicative): GBP/EUR: 1.1713-1.1780 | GBP/USD: 1.2681-1.2772
- Specialist money transfer rates (indicative): GBP/EUR 1.1880-1.1926 | GBP/USD: 1.2860-1.2920 >> More details
The gold price was closing in on a seven-year high Wednesday and has this week been tipped to rise another five percent in the coming three months, although any further interest rate cuts from the Federal Reserve (Fed) could push the previous metal even higher by the end of 2020.
U.S. Dollar gold prices are closing in on seven-year highs after receiving a shot in the arm from the new coronavirus that’s been ravaging the Chinese populace and economy since late January, although technical analysts at Commerzbank are tipping further gains that could take the precious metal to its highest level since January 2013 over the next three months.
“Gold is starting to break higher from its consolidation range and this is viewed as the market breaking higher from a symmetrical triangle,” says Karen Jones, head of technical analysis for currencies, commodities and bonds at Commerzbank. “We look for a challenge to the 1611 recent high and a move to its upside measured target of 1690/1704 (3 month target).”
The U.S. Dollar gold price was up more than 6% since the start of the year on Wednesday and has risen 20.2% inside the last 12 months although it could have another 5% of uspide to come by the middle of May, Commerzbank says.

Above: Dollar gold price at 4-hour intervals, breaks out from symmetric triange continuation pattern.
This is after the precious metal broke above the top of a “symmetric triangle” continuation pattern on the charts, which had been forming since early January. The triangle provided for a period of consolidation in the aftermath of a rally that can be traced back to October 2018 on the charts.
"Continuation patterns usually indicate that consolidative price activity will resolve in the same direction as the trend that was in effect before the pattern formed," says George Davis CMT, chief technical analyst at RBC Capital Markets and two-time winner of Technical Analyst of the Year. "While this pattern can be bullish in an uptrend or bearish in a downtrend, a price breakout must occur before the three-quarter point of the triangle apex.”
Commerzbank’s Jones says the Dollar gold price should remain in an uptrend so long as it’s above $1535 and that once $1704 has been overcome on a closing basis, the market could then turn its attention to the $1734, $1796 and $1,803. And so long as the current uptrend holds, a return to the all-time high of $1,921 set back in 2011 cannot be ruled out from a technical perspective.
Gold prices are thought to have benefited this year from safe-haven demand resulting from uncertainty over the impact that coronavirus could have on the global economy. But prices have trended higher since October 2018 when the Fed signalled that an end to its interest rate hiking cycle could be drawing near, which encouraged speculation of a turn lower in the U.S. economy and Dollar.
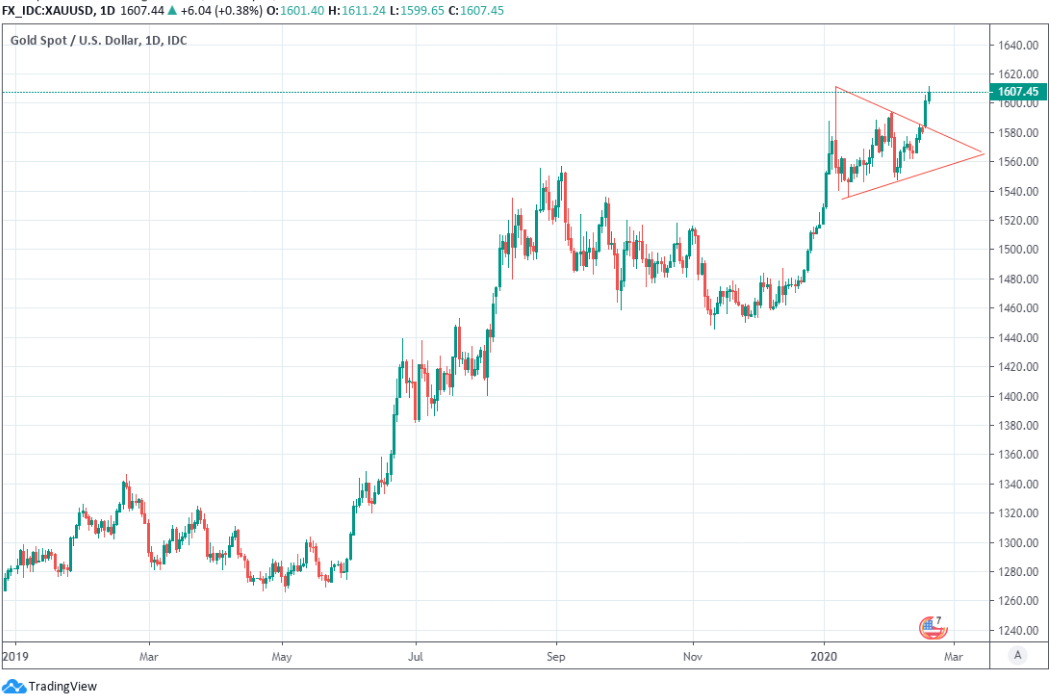
Above: Dollar gold price at daily intervals, breaks out from symmetric triange continuation pattern.
“Risk appetite has returned to financial markets as fears of a further uncontrolled spreading of the coronavirus seem to have faded. However, demand for safe havens such as US Treasuries and gold stayed strong nevertheless, reflecting some degree of risk aversion but no massive flight into safety,” says Carsten Menke CFA, head of next generation research at Julius Baer.
Asia Pacific economies are thought to be suffering greatly amid the fallout from the new coronavirus that's brought China to an effective halt, with Apple Inc warning Tuesday that it will miss 2020 revenue guidance that was only just issued back in January while the South Korean President called his country’s situation an economic emergency.
Such talk and disruption indicates severe economic problems in China and trouble ahead for the global economy including the already-ailing Eurozone. Given how the U.S.-China trade war at least appeared to hurt the Eurozone economy more than it did the two protagonists in the tariff fight, the single currency bloc might also be among the bigger casualties this time around too.
“Physically backed gold products, our preferred indicator of safe-haven demand, continued to exhibit inflows since the outbreak,” Menke says. "The US dollar, another safe haven, has meanwhile risen to the highest levels in around two and half years. Gold and the dollar mostly move into opposite directions while moves in the same direction are typically related to risk aversion."

Above: Dollar gold price shown at daily intervals, rising alongside Dollar Index (blue line).
Julius Baer’s outlook for gold may only recently have been described as bullish although January’s price gains have left the Swiss private bank’s forecasts appearing on the bearish side. It projects gold will retreat back to $1,525 in three-months time before recovering to only $1,600 in time for year-end, although recent gains mean that both forecasts imply that losses are ahead.
It’s often said that gold moves in the opposite direction to the Dollar and that a weaker Dollar is required for gold to rise in value, although that idea is contradicted by 2020’s moves, which came alongside strength in the greenback. Not only that but the greenback has trended higher since early 2018, the Dollar Index shows, but this didn’t stop the gold price rising.
“While Gold pricing was aligned with a shift in the Fed in 2019, its NOT only a hedge to potential Fed cuts. Pricing also incorporates the threat of fear drivers,” says Nicky Shiels, a metals strategist at Scotiabank. “Gold has entered a new bull market and begun to internalize geopolitical, political, trade & growth risks, which is a constructive new development, compared to its responsiveness over the previous 6 year bear market”
The kind of negative correlation that’s said to exist between the price of gold and the Dollar is clearer and more easily observable in the relationship between U.S. Treasury bond yields and the Dollar-denominated price of gold.

Above: Dollar gold price shown at weekly intervals alongside 10-year 'risk free' rate bond yield (orange line).
Those yields have been declining ever since October 2018 when the Fed signalled that rate cuts might not be far off, and they’ve been falling for the same reasons gold is thought tobe rising. The Fed has since cut U.S. rates three times, taking the Fed Funds rate range down to between 1.5% and 1.75%.
“GOLD is under priced & cheap given reigniting growth fears which is being fought with additional stimulus from (virus infected) [central banks], but also the Fed who could be induced to cut earlier, or at the very least, expand their [balance sheet] at a faster pace; they’ve shown that they can quickly respond to any threat to global growth,” Shiels writes, in a February update to clients. “$1540-1550 is a buy opportunity, and the start of a new floor into a year where growth risks are firmly tilted to the downside.”
Shiels expressed disappointment earlier in February that gold hadn’t already broken above $1,600 and told clients to stay the course and remain positioned for increases in prices due to safe-haven demand that's expected to prove a boon for the metal throughout 2020. One catalyst for this ongoing demand is likely to be Fed interest rate policy, Shiels says.

Above: Dollar gold price rises as 2-year yield (orange line) falls below the 1.5% bottom of current Fed Funds rate range.
The Fed’s interest rate decisions dictate movements in the bond yields that have a very clear, negative relationship with the price of gold, with lower rates auguring lower yields and a higher gold price. 2-year U.S. government bond yields were trading at 1.44% and below the bottom of the current Fed Funds rate range on Wednesday but could move even lower this year if the bank can be persuaded to actually deliver on market pricing that’s in favour of at least one more cut, to 1.25%-to-1.5% in the months ahead.
“Chinese New Year is supposed to be a strong period of both Gold (and Platinum) jewelry demand so this event knocks that physical support. That (physical) demand destruction should be offset by Western inflows hinged on the theme of slower economic / growth forecasts being fought with additional stimulus,” says Shiels, who told clients in January that gold has entered a new ‘bull market’. “Virus headline risk & uncertainty remains high, trade issues may reemerge given the dent to demand, and consensus Chinese GDP at about 6% YoY is likely to be convincingly downgraded.”
Shiels forecast back in January that gold would average $1,600 this year, with the $1,700 threshold being labelled a “soft ceiling” and the $1,800 said to be a credible proposition in a “bullish scenario,” although the latter was originally estimated to have only a 30% probability. However, she warned in February that Scotiabank forecasts could be imminently revised in light of recent events.


